Skipping the package repository setup step will result in these errors (seen on x64 5.10.102.1-microsoft-standard-WSL2 but all other steps and output are from a VM):
Reading package lists... Done
Building dependency tree... Done
Reading state information... Done
Package docker-ce is not available, but is referred to by another package.
This may mean that the package is missing, has been obsoleted, or
is only available from another source

E: Package 'docker-ce' has no installation candidate
E: Unable to locate package docker-ce-cli
E: Unable to locate package containerd.io
E: Couldn't find any package by glob 'containerd.io'
E: Couldn't find any package by regex 'containerd.io'
E: Unable to locate package docker-buildx-plugin
E: Unable to locate package docker-compose-plugin
I list the available containers by running docker ps and there are none, but this verifies that docker is working.
saint@ubuntuvm:~$ sudo docker ps
CONTAINER ID   IMAGE     COMMAND   CREATED   STATUS    PORTS     NAMES
saint@ubuntuvm:~$
The hello-world image runs successfully as well.
saint@ubuntuvm:~$ sudo docker run hello-world
Unable to find image 'hello-world:latest' locally
latest: Pulling from library/hello-world
719385e32844: Pull complete
Digest: sha256:88ec0acaa3ec199d3b7eaf73588f4518c25f9d34f58ce9a0df68429c5af48e8d
Status: Downloaded newer image for hello-world:latest

Hello from Docker!
This message shows that your installation appears to be working correctly.

To generate this message, Docker took the following steps:
 1. The Docker client contacted the Docker daemon.
 2. The Docker daemon pulled the "hello-world" image from the Docker Hub.
    (amd64)
 3. The Docker daemon created a new container from that image which runs the
    executable that produces the output you are currently reading.
 4. The Docker daemon streamed that output to the Docker client, which sent it
    to your terminal.

To try something more ambitious, you can run an Ubuntu container with:
 $ docker run -it ubuntu bash

Share images, automate workflows, and more with a free Docker ID:
 https://hub.docker.com/

For more examples and ideas, visit:
 https://docs.docker.com/get-started/

saint@ubuntuvm:~$
Running Docker in WSL
I followed the above steps to install docker in my Windows Subsystem for Linux Ubuntu 22.04.2 LTS environment. Unfortunately, docker ps does not work.
saint@mymachine:~$ sudo docker ps
Cannot connect to the Docker daemon at unix:///var/run/docker.sock. Is the docker daemon running?
saint@mymachine:~$
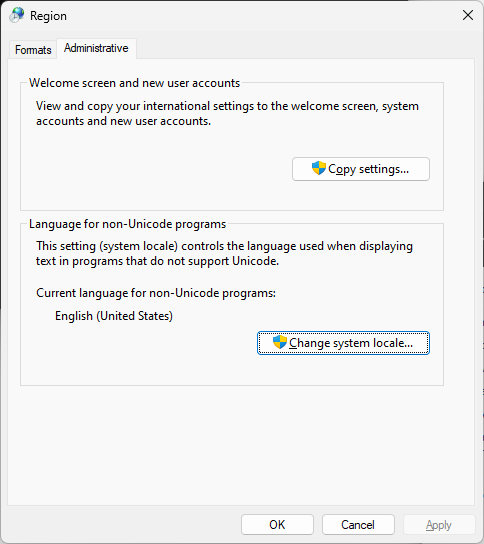
To change the active code page, go to Control Panel > Region. Click on the “Change system locale…” button in the Administrative tab.
The Region Dialog Box
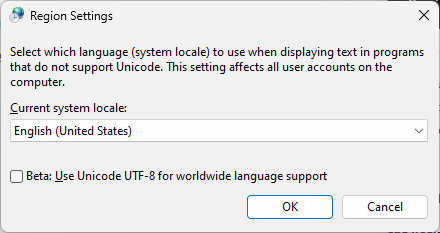
The Region Settings dialog will pop up. Select a different locale e.g. Japanese (Japan).
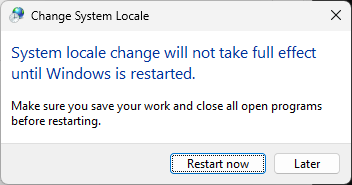
Reboot when prompted. You can verify (even before rebooting) that the active and OEM code pages have changed. Locales like Kiswahili (Kenya) and English (India) did not change the code page values (and therefore didn’t prompt to reboot).
After rebooting, I delete the build directory then configure and build OpenJDK again. This time the build fails with these errors:
ERROR: Build failed for target 'images' in configuration 'windows-x86_64-server-slowdebug' (exit code 2)
Stopping javac server

=== Output from failing command(s) repeated here ===
* For target hotspot_variant-server_libjvm_gtest_objs_test_json.obj:
test_json.cpp
d:\java\forks\jdk\test\hotspot\gtest\utilities\test_json.cpp(357): error C2143: syntax error: missing ')' before ']'
d:\java\forks\jdk\test\hotspot\gtest\utilities\test_json.cpp(355): error C2660: 'JSON_GTest::test': function does not take 1 arguments
d:\java\forks\jdk\test\hotspot\gtest\utilities\test_json.cpp(49): note: see declaration of 'JSON_GTest::test'
d:\java\forks\jdk\test\hotspot\gtest\utilities\test_json.cpp(355): note: while trying to match the argument list '(const char [171])'
d:\java\forks\jdk\test\hotspot\gtest\utilities\test_json.cpp(357): error C2143: syntax error: missing ';' before ']'
d:\java\forks\jdk\test\hotspot\gtest\utilities\test_json.cpp(357): error C2059: syntax error: ']'
d:\java\forks\jdk\test\hotspot\gtest\utilities\test_json.cpp(357): error C2017: illegal escape sequence
d:\java\forks\jdk\test\hotspot\gtest\utilities\test_json.cpp(357): error C2059: syntax error: ')'
d:\java\forks\jdk\test\hotspot\gtest\utilities\test_json.cpp(363): error C2143: syntax error: missing ')' before ']'
d:\java\forks\jdk\test\hotspot\gtest\utilities\test_json.cpp(361): error C2660: 'JSON_GTest::test': function does not take 1 arguments
d:\java\forks\jdk\test\hotspot\gtest\utilities\test_json.cpp(49): note: see declaration of 'JSON_GTest::test'
d:\java\forks\jdk\test\hotspot\gtest\utilities\test_json.cpp(361): note: while trying to match the argument list '(const char [174])'
d:\java\forks\jdk\test\hotspot\gtest\utilities\test_json.cpp(363): error C2143: syntax error: missing ';' before ']'
d:\java\forks\jdk\test\hotspot\gtest\utilities\test_json.cpp(363): error C2059: syntax error: ']'
   ... (rest of output omitted)

* All command lines available in /cygdrive/d/java/forks/jdk/build/windows-x86_64-server-slowdebug/make-support/failure-logs.
=== End of repeated output ===

No indication of failed target found.
HELP: Try searching the build log for '] Error'.
HELP: Run 'make doctor' to diagnose build problems.
The Visual C++ compiler’s behavior when reading source files depends on whether or not source files have a byte-order mark.
By default, Visual Studio detects a byte-order mark to determine if the source file is in an encoded Unicode format, for example, UTF-16 or UTF-8. If no byte-order mark is found, it assumes that the source file is encoded in the current user code page, unless you’ve specified a code page by using /utf-8 or the /source-charset option.
This can be easily tested using hexdump in Cygwin. Launch notepad and open the test.txt file created by these commands. The File > Save as dialog has an Encoding dropdown that write a byte-order marker for any of the UTF options. Running hexdump will display the byte-order markers.
echo abc123 > test.txt
hexdump -C test.txt
Inspect the OpenJDK source file failing to build confirms that there is no BOM in the file. (can this be done on GitHub?)
diff --git a/make/autoconf/flags-cflags.m4 b/make/autoconf/flags-cflags.m4
index c0c78ce95b6..bbb0426c368 100644
--- a/make/autoconf/flags-cflags.m4
+++ b/make/autoconf/flags-cflags.m4
@@ -560,7 +560,9 @@ AC_DEFUN([FLAGS_SETUP_CFLAGS_HELPER],
     TOOLCHAIN_CFLAGS_JVM="-qtbtable=full -qtune=balanced -fno-exceptions \
         -qalias=noansi -qstrict -qtls=default -qnortti -qnoeh -qignerrno -qstackprotect"
   elif test "x$TOOLCHAIN_TYPE" = xmicrosoft; then
-    TOOLCHAIN_CFLAGS_JVM="-nologo -MD -Zc:preprocessor -Zc:strictStrings -Zc:inline -MP"
+    # The -utf8 option sets source and execution character sets to UTF-8 to enable correct
+    # compilation of all source files regardless of the active code page on Windows.
+    TOOLCHAIN_CFLAGS_JVM="-nologo -MD -Zc:preprocessor -Zc:strictStrings -Zc:inline -MP -utf-8"
     TOOLCHAIN_CFLAGS_JDK="-nologo -MD -Zc:preprocessor -Zc:strictStrings -Zc:inline -Zc:wchar_t-"
   fi
The build still fails but this time the error is from the java.desktop tree.
ERROR: Build failed for target 'images' in configuration 'windows-x86_64-server-slowdebug' (exit code 2)

=== Output from failing command(s) repeated here ===
* For target support_native_java.desktop_libfreetype_afblue.obj:
afblue.c
d:\java\forks\jdk\src\java.desktop\share\native\libfreetype\src\autofit\afblue.c(1): error C2220: the following warning is treated as an error
d:\java\forks\jdk\src\java.desktop\share\native\libfreetype\src\autofit\afblue.c(1): warning C4819: The file contains a character that cannot be represented in the current code page (932). Save the file in Unicode format to prevent data loss
d:\java\forks\jdk\src\java.desktop\share\native\libfreetype\src\autofit\afscript.h(1): warning C4819: The file contains a character that cannot be represented in the current code page (932). Save the file in Unicode format to prevent data loss
d:\java\forks\jdk\src\java.desktop\share\native\libfreetype\src\autofit\afblue.c(257): warning C4819: The file contains a character that cannot be represented in the current code page (932). Save the file in Unicode format to prevent data loss
   ... (rest of output omitted)
* For target support_native_java.desktop_libfreetype_afcjk.obj:
afcjk.c
...
Let us try using JITWatch on the sample Factorization program I have been using to learn about systems performance. Use these instructions from that blog post to get JITWatch:
git clone https://github.com/AdoptOpenJDK/jitwatch.git
cd jitwatch
mvn clean package
# Produces an executable jar in ui/target/jitwatch-ui-shaded.jar

java -jar ui/target/jitwatch-ui-shaded.jar
Start the factorization sample application such that a hotspot log file is generated. To do so, use the flags listed in the JITWatch Instructions · AdoptOpenJDK/jitwatch Wiki (github.com). I decide to redirect the output to a file to avoid filling the script with the additional logging output.
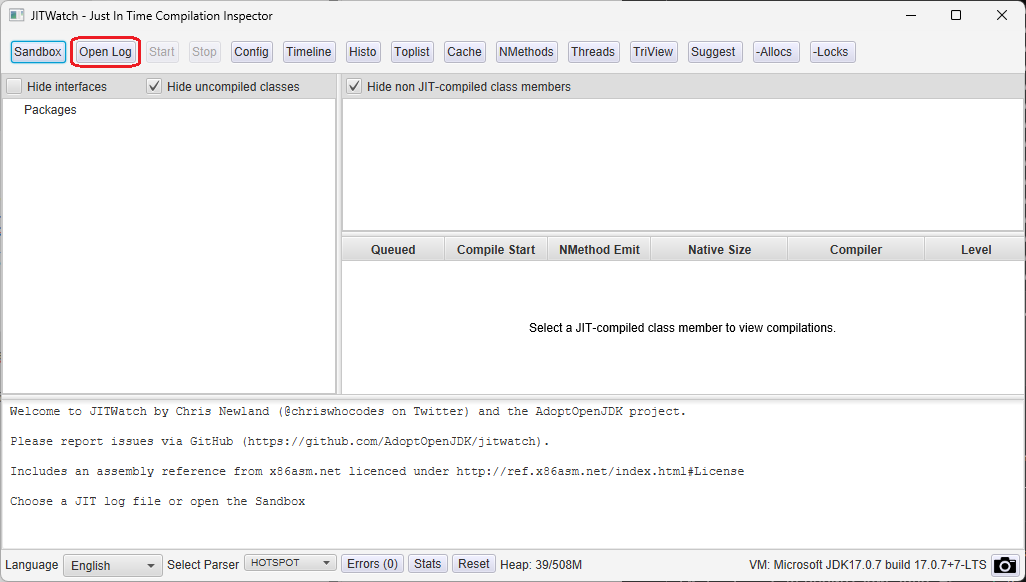
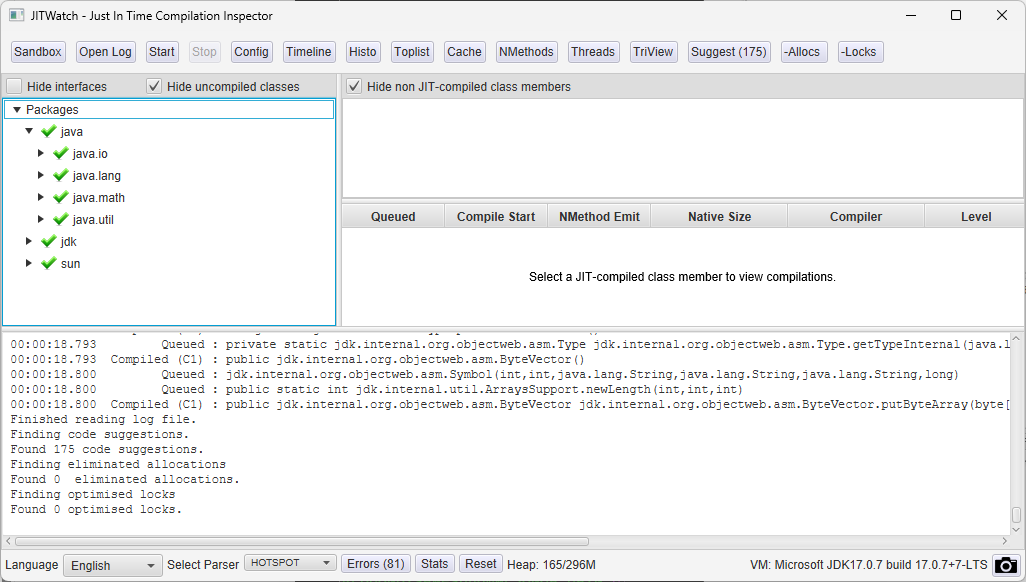
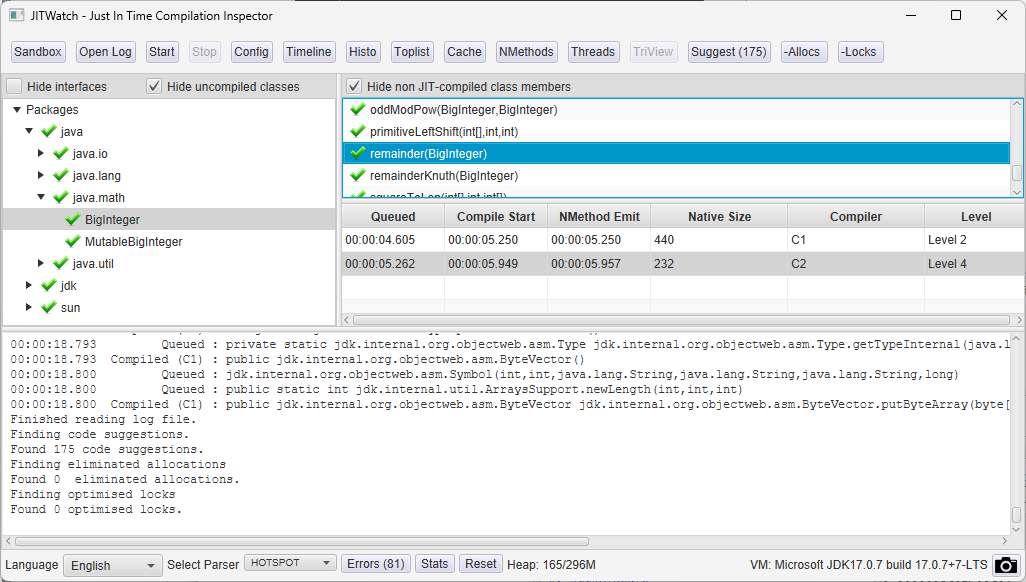
Click on the “Open Log” button in JITWatch then select the hotspot*.log file. Next, click on the Start button to process the JIT log.
Opening a HotSpot Log FileProcessed HotSpot LogViewing JIT-compiled Class Members
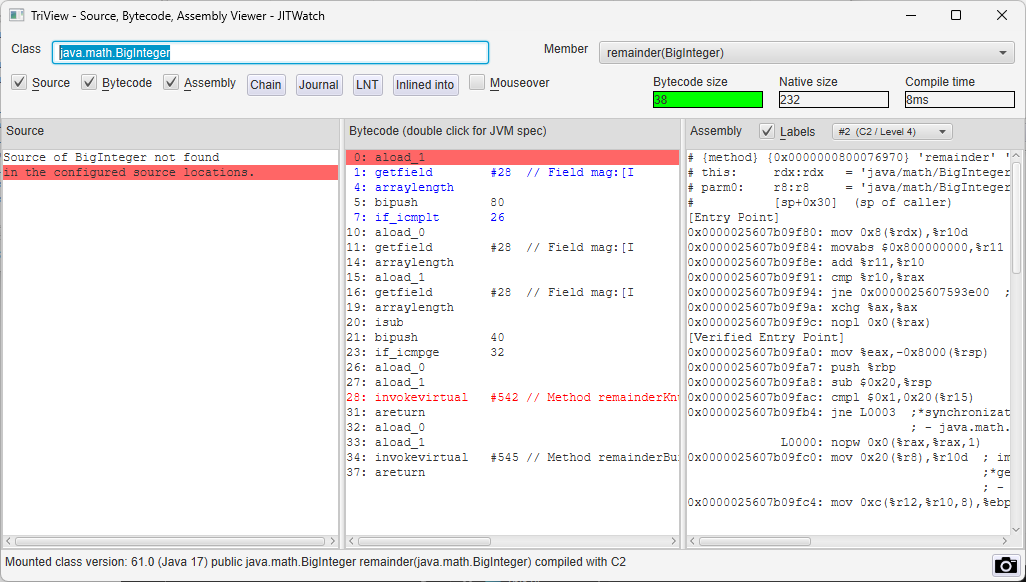
Clicking on a class member opens another window with the corresponding assembly instructions generated by the JIT. I haven’t set up any source code locations but the assembly instructions are still displayed.
Setting up MVN on Windows
To run JITWatch on Windows, download the Maven binaries from Maven – Download Apache Maven and verify the hashes using certutil. Extract the downloaded .zip file using tar. Here are the instructions I used in Git Bash.
mkdir -p /c/java/binaries/apache
cd /c/java/binaries/apache

curl -Lo apache-maven-3.9.3-bin.zip https://dlcdn.apache.org/maven/maven-3/3.9.3/binaries/apache-maven-3.9.3-bin.zip

certutil -hashfile apache-maven-3.9.3-bin.zip SHA512
# shasum -a 512 apache-maven-3.9.3-bin.zip

tar xf apache-maven-3.9.3-bin.zip
Paste the lines below into a Dockerfile. See the Dockerfile reference for more information about Dockerfile commands.
FROM mcr.microsoft.com/cbl-mariner/base/core:2.0
Build the image by running docker build -t testimage . in the directory containing the Dockerfile. The output looks like this (hashes truncated to 16 characters):
It is sometimes essential to have the container run in detached mode, e.g. when you have a single command line interface available (e.g. via SSH) and don’t want to connect to the host again. Start the container using docker run then connect to it using docker attach.
docker run -dit --name mycontainer testimage
docker attach mycontainer
Other than the machine name, WSL’s Ubuntu 22.04.2 LTS has the same uname -a output as the docker container from the test image created above (on my x64 Windows 11 machine): Linux 9a13d5e98075 5.10.102.1-microsoft-standard-WSL2 #1 SMP Wed Mar 2 00:30:59 UTC 2022 x86_64 x86_64 x86_64 GNU/Linux.
As I learn about systems performance, one question that often arises is who is responsible for the context switching on a system. In Linux, the number of context switches per second is displayed by vmstat. To see this information every second, for example, run vmstat 1. Here is sample output from my Ubuntu 22.04 VM showing about 50000 context switches per sec. I used the -SM option to display memory info in Megabytes (which reduces the amount of output per line). The last (optional) argument is the number of updates (lines) to be displayed.
saint@ubuntuvm:~$ vmstat -SM 1 5
procs -----------memory---------- ---swap-- -----io---- -system-- ------cpu-----
 r  b   swpd   free   buff  cache   si   so    bi    bo   in   cs us sy id wa st
 2  0      0   4603    386   5176    0    0     1     5   16    7 35  6 59  0  0
 4  0      0   4603    386   5176    0    0     0    88 20031 45649 51  8 41  0  0
 4  0      0   4603    386   5176    0    0     0     0 23768 52532 49  8 43  0  0
 4  0      0   4603    386   5176    0    0     0     0 23826 52931 49  7 43  0  0
 5  0      0   4603    386   5176    0    0     0     0 23328 51731 49  9 43  0  0
Use pidstat to get a per-process breakdown of context switches per second. Like vmstat, a report delay and a report count can be specified. Without specifying any specific flags, the default output is a breakdown of CPU usage.
For our purposes, we need to specify the -w flag to report task switching activity. After the specified number of reports have been displayed, the average number of context switches (voluntary and involuntary) are displayed.
I happened to have my factorization Java application running on this VM. Interestingly, it does not appear in this output despite the fact that the time command displays a large number of context switches for this application. To see this, set up the application as described in the next section.
Running a Sample Multithreaded Application
Clone the scratchpad repo then compile and launch the factorization application using these instructions (with any necessary changes to the JAVA_HOME path):
# Download a Java build if necessary
mkdir -p ~/java/binaries/jdk/x64
cd ~/java/binaries/jdk/x64
wget https://aka.ms/download-jdk/microsoft-jdk-17.0.7-linux-x64.tar.gz
tar xzf microsoft-jdk-17.0.7-linux-x64.tar.gz

# Set the JAVA_HOME environment variable
export JAVA_HOME=~/java/binaries/jdk/x64/jdk-17.0.7+7

# Get the Factorization source code
mkdir ~/repos
cd ~/repos
git clone https://github.com/swesonga/scratchpad
cd scratchpad/demos/java/FindPrimes

# Compile the factorization source code
$JAVA_HOME/bin/javac Factorize.java

# Factorize a number and display task statistics
/usr/bin/time -v $JAVA_HOME/bin/java Factorize 897151542039582592342572091 CUSTOM_THREAD_COUNT_VIA_THREAD_CLASS 6
Notice the context switching statistics when the command completes:
	Command being timed: "/home/saint/java/binaries/jdk/x64/jdk-20+36/bin/java Factorize 897151542039582592342572091 CUSTOM_THREAD_COUNT_VIA_THREAD_CLASS 6"
	User time (seconds): 37.59
	System time (seconds): 6.47
	Percent of CPU this job got: 363%
	Elapsed (wall clock) time (h:mm:ss or m:ss): 0:12.12
	Average shared text size (kbytes): 0
	Average unshared data size (kbytes): 0
	Average stack size (kbytes): 0
	Average total size (kbytes): 0
	Maximum resident set size (kbytes): 298576
	Average resident set size (kbytes): 0
	Major (requiring I/O) page faults: 8
	Minor (reclaiming a frame) page faults: 70247
	Voluntary context switches: 367393
	Involuntary context switches: 1337
	Swaps: 0
	File system inputs: 0
	File system outputs: 64
	Socket messages sent: 0
	Socket messages received: 0
	Signals delivered: 0
	Page size (bytes): 4096
	Exit status: 0
Per-Thread Task Switching Information
How can get some insight into the context switching in the Java process? We can also display statistics for threads associated with selected tasks using the -t option. We now get insight into Java’s contribution to context switching:
Given the large number of tasks on the system, it may be helpful to focus on Java alone. Running jps shows the pids of the Java processes running. We can pass the PID of interest to pidstat. Only context switches for that process will now be displayed, e.g.
To store encrypted git credentials on disk in Ubuntu, install pass and the git-credential-manager. We will use gpg to generate a key that pass will use for secure storage and retrieval of credentials. Use these commands to get everything set up for git:
saint@ubuntuvm:~/repos/scratchpad$ git push
Username for 'https://github.com': swesonga
Password for 'https://swesonga@github.com':
remote: Permission to swesonga/scratchpad.git denied to swesonga.
fatal: unable to access 'https://github.com/swesonga/scratchpad/': The requested URL returned error: 403
saint@ubuntuvm:~/repos/scratchpad$ sudo dpkg -i ~/Downloads/gcm-linux_amd64.2.1.2.deb
[sudo] password for saint:
Selecting previously unselected package gcm.
(Reading database ... 272980 files and directories currently installed.)
Preparing to unpack .../gcm-linux_amd64.2.1.2.deb ...
Unpacking gcm (2.1.2) ...
Setting up gcm (2.1.2) ...
saint@ubuntuvm:~/repos/scratchpad$ which git-credential-manager
/usr/local/bin/git-credential-manager
saint@ubuntuvm:~/repos/scratchpad$ git-credential-manager configure
Configuring component 'Git Credential Manager'...
Configuring component 'Azure Repos provider'...
The git push experience is now different:
saint@ubuntuvm:~/repos/scratchpad$ git push
fatal: No credential store has been selected.

Set the GCM_CREDENTIAL_STORE environment variable or the credential.credentialStore Git configuration setting to one of the following options:

  secretservice : freedesktop.org Secret Service (requires graphical interface)
  gpg           : GNU `pass` compatible credential storage (requires GPG and `pass`)
  cache         : Git's in-memory credential cache
  plaintext     : store credentials in plain-text files (UNSECURE)

See https://aka.ms/gcm/credstores for more information.

Username for 'https://github.com':
saint@ubuntuvm:~/repos/scratchpad$ git config --global credential.credentialStore
saint@ubuntuvm:~/repos/scratchpad$ git push
fatal: Password store has not been initialized at '/home/saint/.password-store'; run `pass init <gpg-id>` to initialize the store.
See https://aka.ms/gcm/credstores for more information.
Username for 'https://github.com':
Since I own the VM, I don’t mind credentials being stored on disk (but not in plain text), so I set up gpg and pass as instructed.
saint@ubuntuvm:~$ gpg --gen-key
gpg (GnuPG) 2.2.27; Copyright (C) 2021 Free Software Foundation, Inc.
This is free software: you are free to change and redistribute it.
There is NO WARRANTY, to the extent permitted by law.

Note: Use "gpg --full-generate-key" for a full featured key generation dialog.

GnuPG needs to construct a user ID to identify your key.

Real name: Saint Wesonga
Email address: saint@swesonga.org
You selected this USER-ID:
    "Saint Wesonga <saint@swesonga.org>"
...

saint@ubuntuvm:~$ sudo apt install pass
[sudo] password for saint:
Reading package lists... Done
Building dependency tree... Done
Reading state information... Done
The following additional packages will be installed:
  libqrencode4 qrencode tree xclip
Suggested packages:
  libxml-simple-perl python ruby
The following NEW packages will be installed:
  libqrencode4 pass qrencode tree xclip
0 upgraded, 5 newly installed, 0 to remove and 92 not upgraded.
Need to get 151 kB of archives.
After this operation, 442 kB of additional disk space will be used.
Do you want to continue? [Y/n]
...

saint@ubuntuvm:~$ pass init ABCDEF0123456789
mkdir: created directory '/home/saint/.password-store/'
Password store initialized for ABCDEF0123456789
Apparently I used the wrong value for the key but git push is unfazed – it pushes successfully after the browser authentication completes. I’m not sure what is happening now since browser authentication is in use but as long as I can push, I can forge ahead with other tasks.
saint@ubuntuvm:~/repos/scratchpad$ git push
info: please complete authentication in your browser...
fatal: Failed to encrypt file '/home/saint/.password-store/git/https/github.com/swesonga.gpg' with gpg. exit=2, out=, err=gpg: <WRONG HEX VALUE>: skipped: No public key
gpg: [stdin]: encryption failed: No public key

Enumerating objects: 11, done.
Counting objects: 100% (11/11), done.
Delta compression using up to 6 threads
Compressing objects: 100% (5/5), done.
Writing objects: 100% (6/6), 745 bytes | 745.00 KiB/s, done.
Total 6 (delta 3), reused 0 (delta 0), pack-reused 0
remote: Resolving deltas: 100% (3/3), completed with 3 local objects
Update: 2023-09-20. Use pass rm -r git to authenticate in the browser the next time git push is executed (e.g. if the password store secret is lost).
When Experimenting with perf on Linux, I used an Ubuntu VM. This can be a bit more cumbersome when simply trying to understand what various Linux commands can do. I decided to try using WSL to experiment with perf. Running wsl from the command line was sufficient to determine how to install the Ubuntu distribution.
C:\dev> wsl
Windows Subsystem for Linux has no installed distributions.
Distributions can be installed by visiting the Microsoft Store:
https://aka.ms/wslstore
C:\dev> wsl --install
Windows Subsystem for Linux is already installed.
The following is a list of valid distributions that can be installed.
Install using 'wsl --install -d <Distro>'.
NAME FRIENDLY NAME
Ubuntu Ubuntu
Debian Debian GNU/Linux
kali-linux Kali Linux Rolling
Ubuntu-18.04 Ubuntu 18.04 LTS
Ubuntu-20.04 Ubuntu 20.04 LTS
Ubuntu-22.04 Ubuntu 22.04 LTS
OracleLinux_7_9 Oracle Linux 7.9
OracleLinux_8_7 Oracle Linux 8.7
OracleLinux_9_1 Oracle Linux 9.1
SUSE-Linux-Enterprise-Server-15-SP4 SUSE Linux Enterprise Server 15 SP4
openSUSE-Leap-15.4 openSUSE Leap 15.4
openSUSE-Tumbleweed openSUSE Tumbleweed
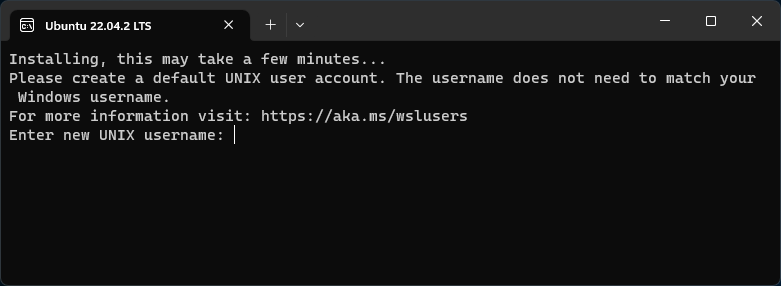
C:\dev> wsl --install -d Ubuntu-22.04
Installing: Ubuntu 22.04 LTS
Ubuntu 22.04 LTS has been installed.
Launching Ubuntu 22.04 LTS...
Creating a UNIX user account
Installing perf
Install the linux-tools-generic package then check the perf version as follows:
Once the WSL Ubuntu distro installation completed and I have created a user account, I start by checking the perf --version lets you know how it can be installed:
saint@machine:~$ perf --version
Command 'perf' not found, but can be installed with:
sudo apt install linux-intel-iotg-tools-common    # version 5.15.0-1027.32, or
sudo apt install linux-nvidia-tools-common        # version 5.15.0-1023.23
sudo apt install linux-tools-common               # version 5.15.0-71.78
sudo apt install linux-nvidia-5.19-tools-common   # version 5.19.0-1009.9
sudo apt install linux-nvidia-tegra-tools-common  # version 5.15.0-1012.12
Since I’m not looking for anything vendor specific, I try to install the linux-tools-common package.
saint@machine:~$ sudo apt install linux-tools-common
Reading package lists... Done
Building dependency tree... Done
Reading state information... Done
The following NEW packages will be installed:
  linux-tools-common
0 upgraded, 1 newly installed, 0 to remove and 0 not upgraded.
Need to get 290 kB of archives.
After this operation, 823 kB of additional disk space will be used.
Ign:1 http://archive.ubuntu.com/ubuntu jammy-updates/main amd64 linux-tools-common all 5.15.0-71.78
Err:1 http://security.ubuntu.com/ubuntu jammy-updates/main amd64 linux-tools-common all 5.15.0-71.78
  404  Not Found [IP: ... 80]
E: Failed to fetch http://security.ubuntu.com/ubuntu/pool/main/l/linux/linux-tools-common_5.15.0-71.78_all.deb  404  Not Found [IP: ... 80]
E: Unable to fetch some archives, maybe run apt-get update or try with --fix-missing?
saint@machine:~$ sudo apt install linux-tools-common
Reading package lists... Done
Building dependency tree... Done
Reading state information... Done
The following NEW packages will be installed:
  linux-tools-common
0 upgraded, 1 newly installed, 0 to remove and 41 not upgraded.
Need to get 277 kB of archives.
After this operation, 833 kB of additional disk space will be used.
Get:1 http://archive.ubuntu.com/ubuntu jammy-updates/main amd64 linux-tools-common all 5.15.0-73.80 [277 kB]
Fetched 277 kB in 0s (793 kB/s)
Selecting previously unselected package linux-tools-common.
(Reading database ... 24137 files and directories currently installed.)
Preparing to unpack .../linux-tools-common_5.15.0-73.80_all.deb ...
Unpacking linux-tools-common (5.15.0-73.80) ...
Setting up linux-tools-common (5.15.0-73.80) ...
Processing triggers for man-db (2.10.2-1) ...
Can we run a perf command now? No, perf not found for my kernel.
saint@machine:~$ perf --version
WARNING: perf not found for kernel 5.10.102.1-microsoft

  You may need to install the following packages for this specific kernel:
    linux-tools-5.10.102.1-microsoft-standard-WSL2
    linux-cloud-tools-5.10.102.1-microsoft-standard-WSL2

  You may also want to install one of the following packages to keep up to date:
    linux-tools-standard-WSL2
    linux-cloud-tools-standard-WSL2
Is that really my kernel version? Yes it is.
saint@mymachine:~$ uname -a
Linux mymachine 5.10.102.1-microsoft-standard-WSL2 #1 SMP Wed Mar 2 00:30:59 UTC 2022 x86_64 x86_64 x86_64 GNU/Linux
Unfortunately, the suggested packages cannot be found:
saint@machine:~$ sudo apt install linux-tools-standard-WSL2
Reading package lists... Done
Building dependency tree... Done
Reading state information... Done
E: Unable to locate package linux-tools-standard-WSL2
saint@machine:~$ sudo apt install linux-tools-5.10.102.1-microsoft-standard-WSL2
Reading package lists... Done
Building dependency tree... Done
Reading state information... Done
E: Unable to locate package linux-tools-5.10.102.1-microsoft-standard-WSL2
E: Couldn't find any package by glob 'linux-tools-5.10.102.1-microsoft-standard-WSL2'
nt@machine:~$ sudo apt-get install linux-tools-5.10.102.1-microsoft-standard-WSL2
Reading package lists... Done
Building dependency tree... Done
Reading state information... Done
E: Unable to locate package linux-tools-5.10.102.1-microsoft-standard-WSL2
E: Couldn't find any package by glob 'linux-tools-5.10.102.1-microsoft-standard-WSL2'
E: Couldn't find any package by regex 'linux-tools-5.10.102.1-microsoft-standard-WSL2'
The interesting thing about this is that the version numbers shown in the list of packages to be installed do not match my kernel version. However, the installation succeeds.
saint@machine:~$ sudo apt install linux-tools-generic
Reading package lists... Done
Building dependency tree... Done
Reading state information... Done
The following additional packages will be installed:
  linux-tools-5.15.0-73 linux-tools-5.15.0-73-generic
The following NEW packages will be installed:
  linux-tools-5.15.0-73 linux-tools-5.15.0-73-generic linux-tools-generic
0 upgraded, 3 newly installed, 0 to remove and 41 not upgraded.
Need to get 7931 kB of archives.
After this operation, 27.3 MB of additional disk space will be used.
Do you want to continue? [Y/n] y
Get:1 http://archive.ubuntu.com/ubuntu jammy-updates/main amd64 linux-tools-5.15.0-73 amd64 5.15.0-73.80 [7926 kB]
Get:2 http://archive.ubuntu.com/ubuntu jammy-updates/main amd64 linux-tools-5.15.0-73-generic amd64 5.15.0-73.80 [1786 B]
Get:3 http://archive.ubuntu.com/ubuntu jammy-updates/main amd64 linux-tools-generic amd64 5.15.0.73.71 [2308 B]
Fetched 7931 kB in 2s (5163 kB/s)
Selecting previously unselected package linux-tools-5.15.0-73.
(Reading database ... 24210 files and directories currently installed.)
Preparing to unpack .../linux-tools-5.15.0-73_5.15.0-73.80_amd64.deb ...
Unpacking linux-tools-5.15.0-73 (5.15.0-73.80) ...
Selecting previously unselected package linux-tools-5.15.0-73-generic.
Preparing to unpack .../linux-tools-5.15.0-73-generic_5.15.0-73.80_amd64.deb ...
Unpacking linux-tools-5.15.0-73-generic (5.15.0-73.80) ...
Selecting previously unselected package linux-tools-generic.
Preparing to unpack .../linux-tools-generic_5.15.0.73.71_amd64.deb ...
Unpacking linux-tools-generic (5.15.0.73.71) ...
Setting up linux-tools-5.15.0-73 (5.15.0-73.80) ...
Setting up linux-tools-5.15.0-73-generic (5.15.0-73.80) ...
Setting up linux-tools-generic (5.15.0.73.71) ...
perf --version still fails though. It’s not a symlink to anything else.
saint@machine:~$ ls -l `which perf`
-rwxr-xr-x 1 root root 1622 May 15 07:10 /usr/bin/perf
However, there is a user that was able to use perf by running the tool in the /usr/lib/linux-tools/… directory. Sure enough, this does the trick!
saint@machine:~$ /usr/lib/linux-tools/5.15.0-73-generic/perf --version
perf version 5.15.98
Sharing Files Between Windows and WSL Ubuntu
I was curious about whether I could generate a report from a perf.data file generated on another machine. The docs on Working across file systems show how easy it is to use a file on the Windows file system:
cd /mnt/c/dev/reports
/usr/lib/linux-tools/5.15.0-73-generic/perf report -n --stdio > report.txt
This doesn’t work though. The command fails after about 40 seconds with the error No kallsyms or vmlinux with build-id 5c3d8... was found.
mkdir -p ~/java/binaries/jdk/x64
cd ~/java/binaries/jdk/x64
wget https://aka.ms/download-jdk/microsoft-jdk-17.0.7-linux-x64.tar.gz
tar xzf microsoft-jdk-17.0.7-linux-x64.tar.gz
Test the factorization application to verify that the Java build works.
export JAVA_HOME=~/java/binaries/jdk/x64/jdk-17.0.7+7

cd ~/repos/scratchpad/demos/java/FindPrimes
$JAVA_HOME/bin/javac Factorize.java
$JAVA_HOME/bin/java Factorize 123890571352112309857

# Use 4 threads to speed things up
$JAVA_HOME/bin/java Factorize 123890571352112309857 CUSTOM_THREAD_COUNT_VIA_THREAD_CLASS 4
We will need the PrintAssembly option to disassemble the code generated by the compiler when running a Java program. This option requires diagnostic VM options to be unlocked. This is the full command line for generating the disassembly from the application’s execution. The output is redirected to a code.asm file since it can be voluminous.
In the above example, I have used a Java build in a custom path. If you are using a Java build that is already installed, then a few extra steps might be needed to determine where the JAVA_HOME path, e.g.
saint@ubuntuvm:~$ which java
/usr/bin/java
saint@ubuntuvm:~$ ls -l `which java`
saint@ubuntuvm:~$ ls -l /etc/alternatives/java
cd ~/java/binaries
mkdir spark
cd spark
curl -Lo spark-3.4.0-bin-hadoop3.tgz https://dlcdn.apache.org/spark/spark-3.4.0/spark-3.4.0-bin-hadoop3.tgz

tar xzf spark-3.4.0-bin-hadoop3.tgz
cd spark-3.4.0-bin-hadoop3
Spark needs JAVA_HOME to be set (otherwise the first message displayed will be ERROR: JAVA_HOME is not set and could not be found).
Next, I started the Spark shell by running this command as per the Quick Start docs:
./bin/spark-shell
Notice that the same Hadoop warning from Diagnosing Hadoop Native Library Load Failures showed up again! However, we have already seen that the Hadoop logging level can be customized. The key question now is how to enable DEBUG logging in spark
saint@ubuntuvm:~/java/binaries/spark/spark-3.4.0-bin-hadoop3$ ./bin/spark-shell
23/06/01 10:31:38 WARN Utils: Your hostname, ubuntuvm resolves to a loopback address: 127.0.1.1; using 172.18.28.45 instead (on interface eth0)
23/06/01 10:31:38 WARN Utils: Set SPARK_LOCAL_IP if you need to bind to another address
Setting default log level to "WARN".
To adjust logging level use sc.setLogLevel(newLevel). For SparkR, use setLogLevel(newLevel).
23/06/01 10:31:44 WARN NativeCodeLoader: Unable to load native-hadoop library for your platform... using builtin-java classes where applicable
Spark context Web UI available at http://ubuntuvm.mshome.net:4040
Spark context available as 'sc' (master = local[*], app id = local-1685637105440).
Spark session available as 'spark'.
Welcome to
      ____              __
     / __/__  ___ _____/ /__
    _\ \/ _ \/ _ `/ __/  '_/
   /___/ .__/\_,_/_/ /_/\_\   version 3.4.0
      /_/

Using Scala version 2.12.17 (OpenJDK 64-Bit Server VM, Java 17.0.6)
Type in expressions to have them evaluated.
Type :help for more information.

scala>
The classpath augmentation doc (Using Spark’s “Hadoop Free” Build) is what informs me that the way Spark uses Hadoop can be customized by entries in conf/spark-env.sh. Unfortunately, there are no log level settings in the spark-env.sh.template file in that directory. After a bit of a winding journey, I discover that the way to customize the logging level is to first create a conf/log4j2.properties file by running:
Next, change the logging level by updating this line:
logger.repl.level = warn
Launching the Spark shell now displays a much more informative error message. It is now evident that the paths being searched for native libraries do not include the path we need.
23/06/01 11:16:31 DEBUG NativeCodeLoader: Trying to load the custom-built native-hadoop library...
23/06/01 11:16:31 DEBUG NativeCodeLoader: Failed to load native-hadoop with error: java.lang.UnsatisfiedLinkError: no hadoop in java.library.path: [/usr/java/packages/lib, /usr/lib64, /lib64, /lib, /usr/lib]
23/06/01 11:16:31 DEBUG NativeCodeLoader: java.library.path=/usr/java/packages/lib:/usr/lib64:/lib64:/lib:/usr/lib
23/06/01 11:16:31 WARN NativeCodeLoader: Unable to load native-hadoop library for your platform... using builtin-java classes where applicable
The required flag is the –driver-library-path. Sounds like the extraLibraryPath options didnt’ work because the JVM has already started by the time those are being processed.
It was the SPARK-7261 pull request that led me to look for the log4j2.properties file. Changing rootLogger.level did not have any effect but scrolling through revealed the key line setting logger.repl.level.
When running this test code, I noticed this warning (first message displayed):
2023-05-31 12:31:33,686 WARN util.NativeCodeLoader: Unable to load native-hadoop library for your platform... using builtin-java classes where applicable
Checking for Loadable Native Libraries
The Apache Hadoop 3.3.5 – Native Libraries Guide explains that there is a NativeLibraryChecker that can be run using the command bin/hadoop checknative -a to show which native libraries can/cannot be loaded.
saint@ubuntuvm:~/java/binaries/hadoop/hadoop-3.3.5$ find . -name lib*.so
./lib/native/libhadoop.so
./lib/native/libhdfspp.so
./lib/native/libhdfs.so
./lib/native/libnativetask.so
saint@ubuntuvm:~/java/binaries/hadoop/hadoop-3.3.5$ uname -a
Linux ubuntuvm 5.19.0-41-generic #42~22.04.1-Ubuntu SMP PREEMPT_DYNAMIC Tue Apr 18 17:40:00 UTC 2 x86_64 x86_64 x86_64 GNU/Linux
saint@ubuntuvm:~/java/binaries/hadoop/hadoop-3.3.5$ bin/hadoop checknative -a
2023-05-31 13:36:04,467 WARN util.NativeCodeLoader: Unable to load native-hadoop library for your platform... using builtin-java classes where applicable
Native library checking:
hadoop:  false
zlib:    false
zstd  :  false
bzip2:   false
openssl: false
ISA-L:   false
PMDK:    false
2023-05-31 13:36:04,711 INFO util.ExitUtil: Exiting with status 1: ExitException
Diagnosing Native Library Load Errors
My assumption when seeing that none of these native libraries could be loaded was that I needed to install all those dependencies. I started with lib64z.
saint@ubuntuvm:~/java/binaries/hadoop/hadoop-3.3.5$ sudo apt install lib64z1
Reading package lists... Done
Building dependency tree... Done
Reading state information... Done
The following additional packages will be installed:
  gcc-12-base:i386 krb5-locales libc6:i386 libc6-amd64:i386 libcom-err2:i386 libcrypt1:i386
  libgcc-s1:i386 libgssapi-krb5-2 libgssapi-krb5-2:i386 libidn2-0:i386 libk5crypto3 libk5crypto3:i386
  libkeyutils1:i386 libkrb5-3 libkrb5-3:i386 libkrb5support0 libkrb5support0:i386 libnsl2:i386
  libnss-nis:i386 libnss-nisplus:i386 libssl3 libssl3:i386 libtirpc3:i386 libunistring2:i386
Suggested packages:
  glibc-doc:i386 locales:i386 krb5-doc krb5-user krb5-doc:i386 krb5-user:i386
The following NEW packages will be installed:
  gcc-12-base:i386 krb5-locales lib64z1:i386 libc6:i386 libc6-amd64:i386 libcom-err2:i386
  libcrypt1:i386 libgcc-s1:i386 libgssapi-krb5-2:i386 libidn2-0:i386 libk5crypto3:i386
  libkeyutils1:i386 libkrb5-3:i386 libkrb5support0:i386 libnsl2:i386 libnss-nis:i386
  libnss-nisplus:i386 libssl3:i386 libtirpc3:i386 libunistring2:i386
The following packages will be upgraded:
  libgssapi-krb5-2 libk5crypto3 libkrb5-3 libkrb5support0 libssl3
5 upgraded, 20 newly installed, 0 to remove and 85 not upgraded.
Need to get 10.3 MB/12.2 MB of archives.
After this operation, 38.1 MB of additional disk space will be used.
Do you want to continue? [Y/n]
Interestingly, rerunning checknative still showed false for all the native libraries! Next step was to inspect how the checknative argument is handled. It invokes the hadoop/NativeLibraryChecker.java class, which in turn calls the hadoop/NativeCodeLoader.java. One of the most important observations in the latter file is the additional debug logging available when the library doesn’t load!
The debug output is much now more informative! Notice the warning about the possible platform mismatch of the native library!
saint@ubuntuvm:~/java/binaries/hadoop/hadoop-3.3.5$ bin/hadoop --loglevel DEBUG checknative -a
2023-05-31 14:47:32,624 DEBUG util.NativeCodeLoader: Trying to load the custom-built native-hadoop library...
2023-05-31 14:47:32,625 DEBUG util.NativeCodeLoader: Failed to load native-hadoop with error: java.lang.UnsatisfiedLinkError: /home/saint/java/binaries/hadoop/hadoop-3.3.5/lib/native/libhadoop.so.1.0.0: /home/saint/java/binaries/hadoop/hadoop-3.3.5/lib/native/libhadoop.so.1.0.0: cannot open shared object file: No such file or directory (Possible cause: can't load AARCH64-bit .so on a AMD 64-bit platform)
2023-05-31 14:47:32,625 DEBUG util.NativeCodeLoader: java.library.path=/home/saint/java/binaries/hadoop/hadoop-3.3.5/lib/native
2023-05-31 14:47:32,625 WARN util.NativeCodeLoader: Unable to load native-hadoop library for your platform... using builtin-java classes where applicable
2023-05-31 14:47:32,836 DEBUG util.Shell: setsid exited with exit code 0
Native library checking:
hadoop:  false
zlib:    false
zstd  :  false
bzip2:   false
openssl: false
ISA-L:   false
PMDK:    false
2023-05-31 14:47:32,847 DEBUG util.ExitUtil: Exiting with status 1: ExitException
1: ExitException
	at org.apache.hadoop.util.ExitUtil.terminate(ExitUtil.java:381)
	at org.apache.hadoop.util.ExitUtil.terminate(ExitUtil.java:369)
	at org.apache.hadoop.util.NativeLibraryChecker.main(NativeLibraryChecker.java:154)
2023-05-31 14:47:32,856 INFO util.ExitUtil: Exiting with status 1: ExitException
To determine the architecture for which the shared library was compiled, I started with the objdump -f command as suggested by a StackOverflow post. However, it outputs architecture: UNKNOWN!, which isn’t very useful. The file command from the same post proves to be exactly what I need.
saint@ubuntuvm:~/java/binaries/hadoop/aarch64/hadoop-3.3.5$ objdump -f lib/native/libhadoop.so

lib/native/libhadoop.so:     file format elf64-little
architecture: UNKNOWN!, flags 0x00000150:
HAS_SYMS, DYNAMIC, D_PAGED
start address 0x0000000000005b80

saint@ubuntuvm:~/java/binaries/hadoop/aarch64/hadoop-3.3.5$ file lib/native/libhadoop.so
lib/native/libhadoop.so: symbolic link to libhadoop.so.1.0.0
saint@ubuntuvm:~/java/binaries/hadoop/aarch64/hadoop-3.3.5$ file lib/native/libhadoop.so.1.0.0
lib/native/libhadoop.so.1.0.0: ELF 64-bit LSB shared object, ARM aarch64, version 1 (SYSV), dynamically linked, BuildID[sha1]=19fbe9b0a7449eb05b687721548251af752b869f, with debug_info, not stripped
Turns out I was using an x86-64 Ubuntu VM instead of the aarch64 Ubuntu VM I had created so naturally, hadoop couldn’t load the aarch64 hadoop native library! For the VM I had been using, I needed to get the hadoop build by running:
Checking the loading status of the native libraries now indicates that the hadoop native library can be successfully loaded:
saint@ubuntuvm:~/java/binaries/hadoop/x64/hadoop-3.3.5$ bin/hadoop checknative -a
2023-05-31 14:58:40,869 INFO bzip2.Bzip2Factory: Successfully loaded & initialized native-bzip2 library system-native
2023-05-31 14:58:40,877 INFO zlib.ZlibFactory: Successfully loaded & initialized native-zlib library
2023-05-31 14:58:40,887 WARN erasurecode.ErasureCodeNative: Loading ISA-L failed: Failed to load libisal.so.2 (libisal.so.2: cannot open shared object file: No such file or directory)
2023-05-31 14:58:40,887 WARN erasurecode.ErasureCodeNative: ISA-L support is not available in your platform... using builtin-java codec where applicable
2023-05-31 14:58:41,035 INFO nativeio.NativeIO: The native code was built without PMDK support.
Native library checking:
hadoop:  true /home/saint/java/binaries/hadoop/x64/hadoop-3.3.5/lib/native/libhadoop.so.1.0.0
zlib:    true /lib/x86_64-linux-gnu/libz.so.1
zstd  :  true /lib/x86_64-linux-gnu/libzstd.so.1
bzip2:   true /lib/x86_64-linux-gnu/libbz2.so.1
openssl: false Cannot load libcrypto.so (libcrypto.so: cannot open shared object file: No such file or directory)!
ISA-L:   false Loading ISA-L failed: Failed to load libisal.so.2 (libisal.so.2: cannot open shared object file: No such file or directory)
PMDK:    false The native code was built without PMDK support.
2023-05-31 14:58:41,056 INFO util.ExitUtil: Exiting with status 1: ExitException
Switching to the aarch64 Ubuntu VM also showed the aarch64 hadoop native library being successfully loaded on that platform. In hindsight, the 386 architecture references when I installed lib64z could have been a warning sign if I wasn’t just blasting my way through running these commands.