I want to evaluate the OpenJDK serial collector using a Java program I wrote to factorize natural numbers by trial division. This post is about how to set up the app to run in a Docker container on a Linux host. Since the host is a shared machine, I put all my work under ~/swesonga (my own custom home directory). The directory structure for the container will be under ~/swesonga/container/.
Set up the Factorization App
First, log into Linux machine and download the Java binaries to test:
ssh user@IPaddress
mkdir -p ~/swesonga/container/java/binaries/jdk/x64/
cd ~/swesonga/container/java/binaries/jdk/x64/

curl -Lo microsoft-jdk-21.0.5-linux-x64.tar.gz https://aka.ms/download-jdk/microsoft-jdk-21.0.5-linux-x64.tar.gz

tar xzf microsoft-jdk-21.0.5-linux-x64.tar.gz
cd ~/swesonga/container/
git clone https://github.com/swesonga/factorize

cd ~/swesonga/container/java
curl -Lo commons-cli-1.9.0-bin.tar.gz https://dlcdn.apache.org//commons/cli/binaries/commons-cli-1.9.0-bin.tar.gz
tar xzf commons-cli-1.9.0-bin.tar.gz
Verify that docker is up by running docker version. I got this output:
user@machine:~/swesonga$ docker version
Client: Docker Engine - Community
 Version:           23.0.1
 API version:       1.42
 Go version:        go1.19.5
 Git commit:        a5ee5b1
 Built:             Thu Feb  9 19:46:56 2023
 OS/Arch:           linux/amd64
 Context:           default
Cannot connect to the Docker daemon at unix:///var/run/docker.sock. Is the docker daemon running?
One error I ran into initially was that docker was unable to start the container process. I had missed the COPY command in the Dockerfile so the file couldn’t be found:
user@machine:~/swesonga$ docker run -i -t swesonga-jdk21-testapp
docker: Error response from daemon: failed to create shim task: OCI runtime create failed: runc create failed: unable to start container process: exec: "/home/<user>/swesonga/java/binaries/jdk/x64/jdk-21.0.5+11/bin/java": stat /home/<user>/swesonga/java/binaries/jdk/x64/jdk-21.0.5+11/bin/java: no such file or directory: unknown.
ERRO[0000] error waiting for container:
user@machine:~/swesonga$ docker system df
TYPE            TOTAL     ACTIVE    SIZE      RECLAIMABLE
Images          2         2         1.22GB    443.1MB (36%)
Containers      3         0         0B        0B
Local Volumes   0         0         0B        0B
Build Cache     9         0         776.9MB   776.9MB
user@machine:~/swesonga$ docker system df -v
Images space usage:

REPOSITORY               TAG       IMAGE ID       CREATED          SIZE      SHARED SIZE   UNIQUE SIZE   CONTAINERS
swesonga-jdk21-testapp   latest    682fedf54071   11 minutes ago   1.22GB    443.1MB       776.9MB       2
<none>                   <none>    4c068055cad5   26 minutes ago   443.1MB   443.1MB       0B            1

Containers space usage:

CONTAINER ID   IMAGE                    COMMAND                  LOCAL VOLUMES   SIZE      CREATED          STATUS    NAMES
c77b69082a8a   swesonga-jdk21-testapp   "/home/<user>/swesonga/…"   0               0B        6 minutes ago    Created   awesome_chatelet
58c723638dd2   swesonga-jdk21-testapp   "/home/<user>/swesonga/…"   0               0B        8 minutes ago    Created   sharp_lamport
4a3be55725b5   4c068055cad5             "/home/<user>/swesonga/…"   0               0B        17 minutes ago   Created   lucid_tharp

Local Volumes space usage:

VOLUME NAME   LINKS     SIZE

Build cache usage: 776.9MB
...
I tried pruning the build cache as suggested in that post.
user@machine:~/swesonga$ docker builder prune --all
WARNING! This will remove all build cache. Are you sure you want to continue? [y/N] y
ID                                              RECLAIMABLE     SIZE            LAST ACCESSED
te4o8rbj7s6nh6pluquzummzz                       true            0B              8 minutes ago
n2wbz4gf448fluw4uuogiqxdo*                      true    776.9MB         8 minutes ago
...
Total:  1.554GB
I realized that pruning wasn’t what I needed because now the cache was empty but the containers were still there based on the next output:
user@machine:~/swesonga$ docker system df -v
Images space usage:

REPOSITORY               TAG       IMAGE ID       CREATED          SIZE      SHARED SIZE   UNIQUE SIZE   CONTAINERS
swesonga-jdk21-testapp   latest    682fedf54071   18 minutes ago   1.22GB    443.1MB       776.9MB       2
<none>                   <none>    4c068055cad5   33 minutes ago   443.1MB   443.1MB       0B            1

Containers space usage:

CONTAINER ID   IMAGE                    COMMAND                  LOCAL VOLUMES   SIZE      CREATED          STATUS    NAMES
c77b69082a8a   swesonga-jdk21-testapp   "/home/<user>/swesonga/…"   0               0B        13 minutes ago   Created   awesome_chatelet
58c723638dd2   swesonga-jdk21-testapp   "/home/<user>/swesonga/…"   0               0B        15 minutes ago   Created   sharp_lamport
4a3be55725b5   4c068055cad5             "/home/<user>/swesonga/…"   0               0B        24 minutes ago   Created   lucid_tharp

Local Volumes space usage:

VOLUME NAME   LINKS     SIZE

Build cache usage: 0B

CACHE ID   CACHE TYPE   SIZE      CREATED   LAST USED   USAGE     SHARED
user@machine:~/swesonga$
I should have been using docker ps -a instead! The -a shows the existing containers (regardless of whether they are running).
user@machine:~/swesonga$ docker ps -a
CONTAINER ID   IMAGE          COMMAND                  CREATED          STATUS    PORTS     NAMES
c77b69082a8a   682fedf54071   "/home/<user>/swesonga/…"   16 minutes ago   Created             awesome_chatelet
58c723638dd2   682fedf54071   "/home/<user>/swesonga/…"   18 minutes ago   Created             sharp_lamport
4a3be55725b5   4c068055cad5   "/home/<user>/swesonga/…"   27 minutes ago   Created             lucid_tharp
user@machine:~/swesonga$
I started displaying the Dockerfile before building and one of the errors I ran into was because I hadn’t saved the Dockerfile. Sheesh.
cat Dockerfile
docker build -t swesonga-jdk21-testapp .
docker ps -a
docker run -i -t swesonga-jdk21-testapp
docker ps -a
docker run -i --memory 2GB -t swesonga-jdk21-testapp
Observe the head of the jdk21 GC log below. The total memory is now reported as 2048M. The maximum heap size is 25% of this total, as expected. The initial heap is 32MB and the minimum heap is 8MB.
The test passed on x64 but I wanted to see how to step into the test code itself so I tried this setup in Visual Studio 2022. Unfortunately, it was not straightforward to break into the correct process when launching the test in Visual Studio 2022.
I decided to try to understand the test execution sequence and started by looking at the output generated when running the jtreg test. Notice that the CreateCoredumpOnCrash product flag is disabled. The first thing I did was to enable it so that there is a core dump to examine.
The core dump wasn’t particularly helpful. I worked on simplifying the test so that only the failing scenarios remained. The log in the JBS issue was interpreted code only so I added the -Xint argument and could still reproduce the failure on Windows AArch64.
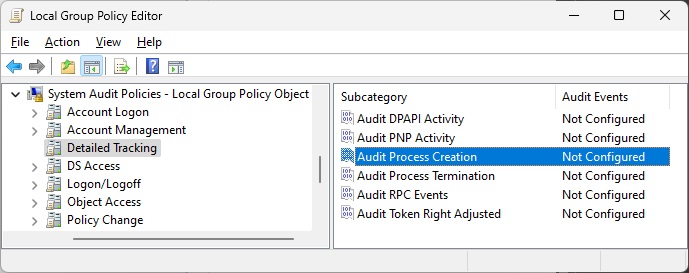
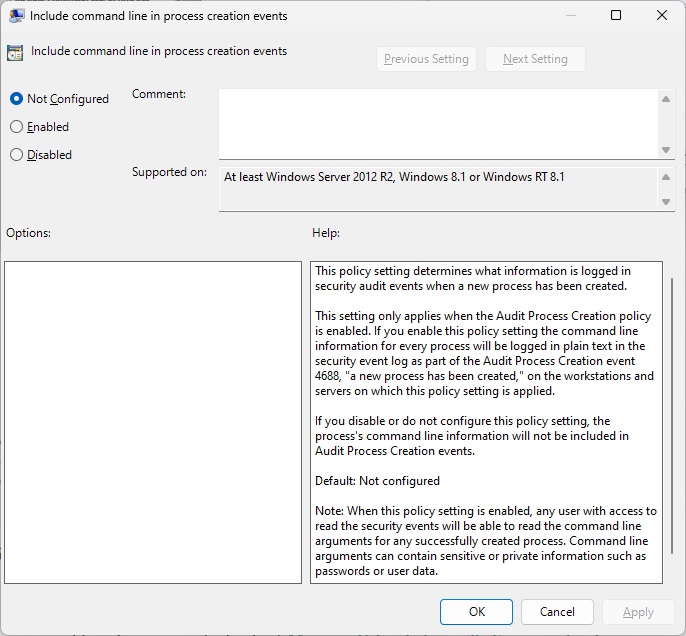
I came back to the idea of capturing the full command line for the final java.exe process that runs the test. Is there a way to log process start on Windows to capture all command lines? Copilot cited PowerShell and Command Line Logging | LogRhythm, which suggested enabling the use of Event ID 4688: a new process has been created.
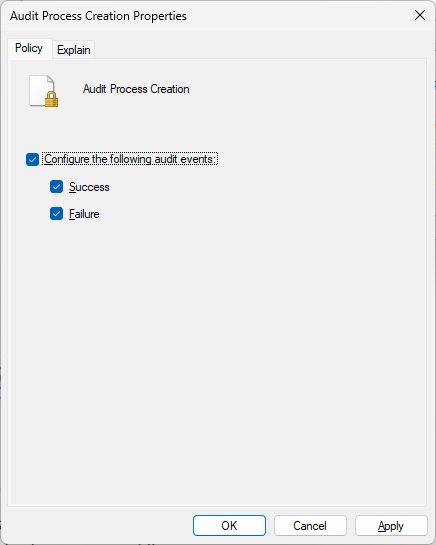
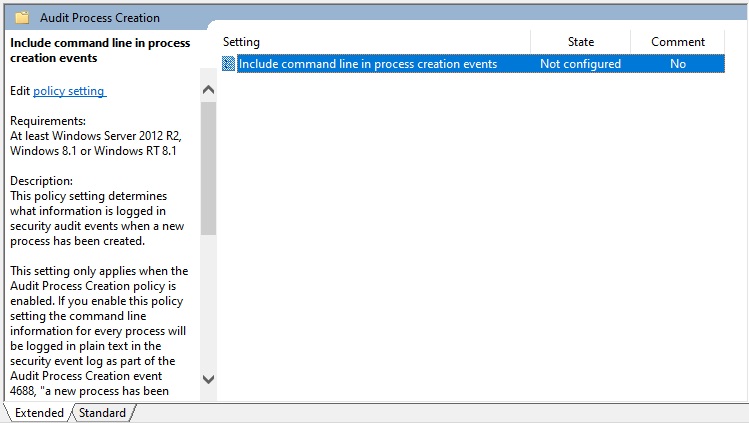
However, the event viewer didn’t have command line arguments when I did this, which is what I needed. I just looked up Event ID 4688 and found 4688(S) A new process has been created. – Windows 10 | Microsoft Learn, which explains that you must enable “Administrative Templates\System\Audit Process Creation\Include command line in process creation events” group policy to include command line in process creation events. Hmm, I definitely didn’t do that when I was investigating this issue. I just tried this and it does the trick!
In the midst of all this wrangling, I decide to write a simple test to spit out the value of the sun.jnu.encoding property. That test runs fine so next step is to use the same flags as the failing jtreg test. However, as I added the ZGC flags to the test command line, I realized that I hadn’t even tried those flags with the java -version. What an oversight! The bug reproduces without running any specific program!
Since the assert happens when cloning an array, I decided to find the native implementation of the clone method. Searched for “clone_” and the only relevant hit (from a quick glance) appeared to be in the LinkResolver::check_method_accessability method.
Command: C:/java/forks/openjdk/jdk/build/windows-aarch64-server-slowdebug/jdk/bin/java.exe

Arguments: -XX:+UseZGC -XX:+ZGenerational -XX:+ZVerifyOops -version

Working Dir: C:/java/forks/openjdk/jdk
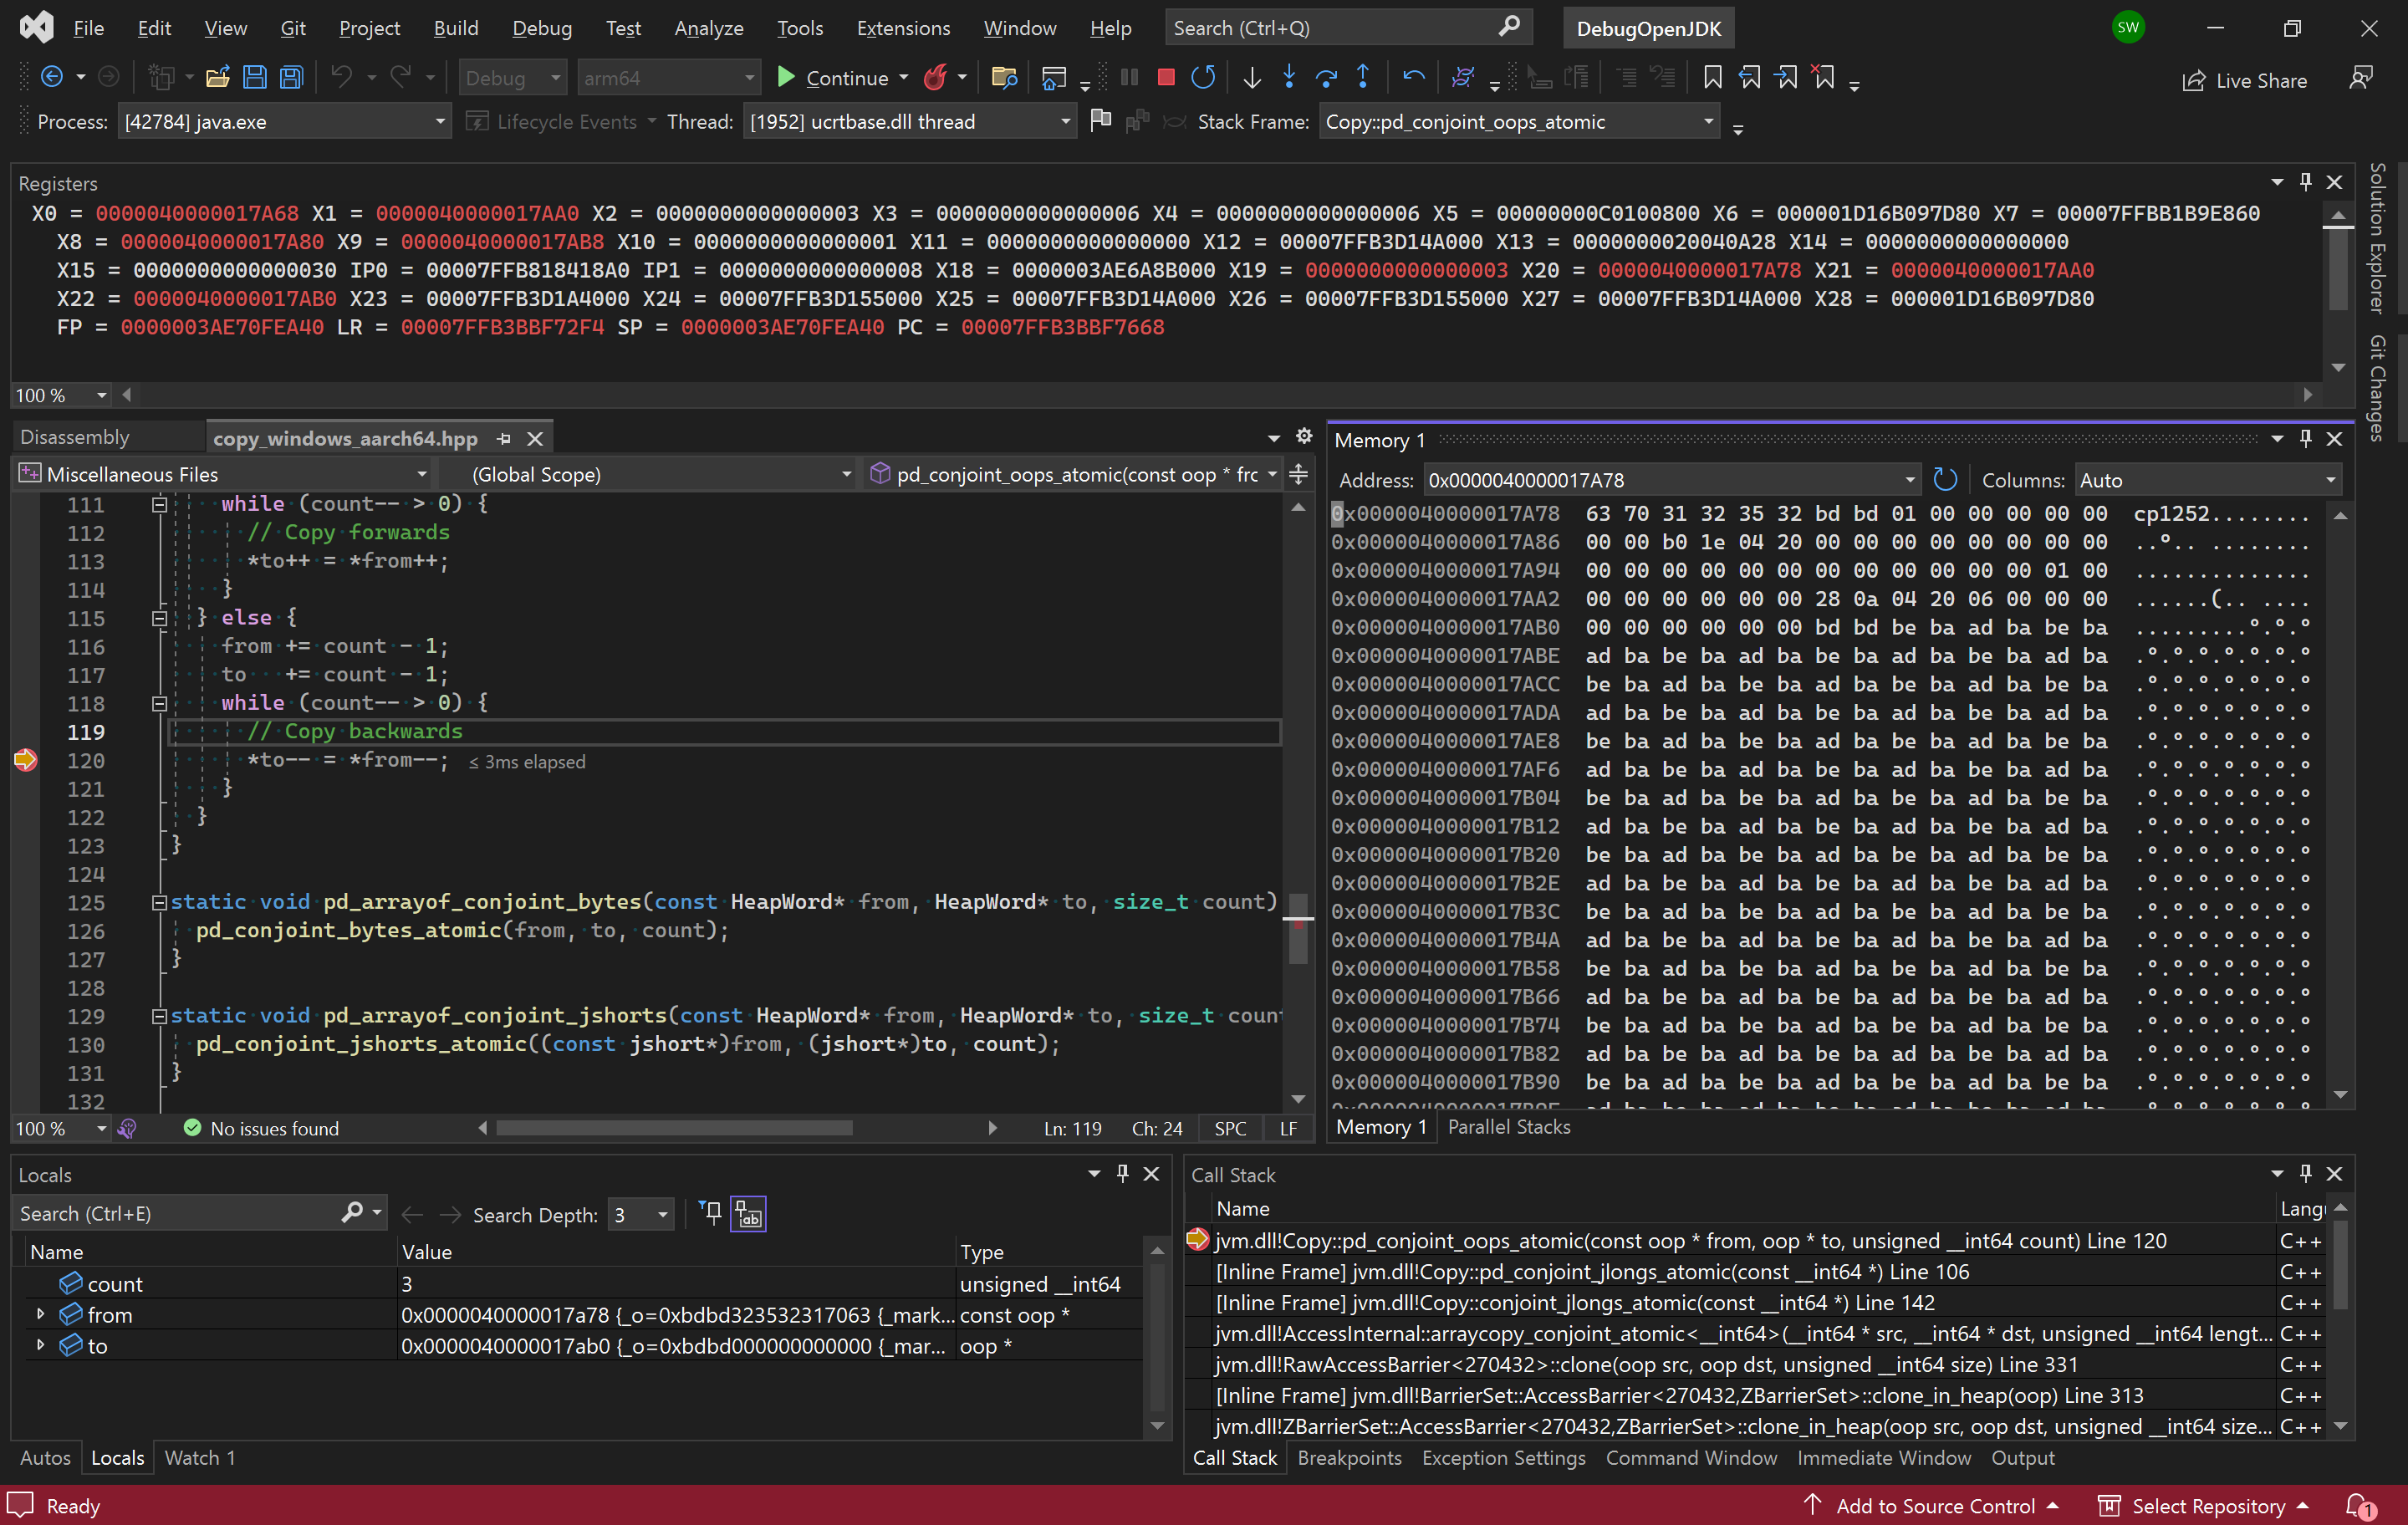
The failure appeared to be happening in this statement: HeapAccess<>::clone(obj(), new_obj_oop, size). I got this callstack by stepping into the calls in the slowdebug build because the is_valid function is inlined in the fastdebug build, preventing me from setting a breakpoint in it.
jvm.dll!is_valid(zaddress addr, bool assert_on_failure) Line 298	C++
jvm.dll!assert_is_valid(zaddress addr) Line 321	C++
jvm.dll!to_zaddress(unsigned __int64 value) Line 339	C++
jvm.dll!to_zaddress(oopDesc * o) Line 345	C++
jvm.dll!ZBarrierSet::AccessBarrier<270432,ZBarrierSet>::clone_in_heap(oopDesc * src, oopDesc * dst, unsigned __int64 size) Line 433	C++
jvm.dll!AccessInternal::PostRuntimeDispatch<ZBarrierSet::AccessBarrier<270400,ZBarrierSet>,9,270400>::access_barrier(oopDesc * src, oopDesc * dst, unsigned __int64 size) Line 200	C++
jvm.dll!AccessInternal::RuntimeDispatch<270400,oopDesc *,9>::clone_init(oopDesc * src, oopDesc * dst, unsigned __int64 size) Line 349	C++
jvm.dll!AccessInternal::RuntimeDispatch<270400,oopDesc *,9>::clone(oopDesc * src, oopDesc * dst, unsigned __int64 size) Line 533	C++
jvm.dll!AccessInternal::PreRuntimeDispatch::clone<270400>(oopDesc * src, oopDesc * dst, unsigned __int64 size) Line 890	C++
jvm.dll!AccessInternal::clone<262144>(oopDesc * src, oopDesc * dst, unsigned __int64 size) Line 1181	C++
jvm.dll!Access<262144>::clone(oopDesc * src, oopDesc * dst, unsigned __int64 size) Line 212	C++
jvm.dll!JVM_Clone(JNIEnv_ * env, _jobject * handle) Line 698	C++
00000298b2bbf056()	Unknown
00000298a2ee5590()	Unknown
000000c053dfe908()	Unknown
Here’s the stack from stepping into the fastdebug assembly (note that line numbers might be off since this is not slowdebug):
I looked at this and searched for UTF-8 byte 0xBD meaning – Search (bing.com) but that didn’t turn up anything meaningful. I noticed that count is 3 on my Aarch64 device so we are copying 3 oops. Was this expected given that the count is 4 on Windows x64? More importantly though, the big question I have now is why doesn’t slowdebug step into the oop checking code when pressing F11 on line 120 in the screenshot? I expected the behavior of oop::on_usage to be different, not that it wouldn’t be called at all! When browsing the sources in VSCode on my x64 desktop, I clicked on the oop type (of the src argument) and it took me to a typedef of class oopDesc*. That’s when I spotted the CHECK_UNHANDLED_OOPS ifndef. The fastdebug build must have this defined! The only non-cpp/hpp file that contains CHECK_UNHANDLED_OOPS is jdk/make/hotspot/lib/JvmFlags.gmk. Sure enough, it is only defined for fastdebug. This means that I should be able to enable it for slowdebug and release and verify whether the behavior is present there. We can therefore configure a slowdebug build with the --with-extra-cflags=-DCHECK_UNHANDLED_OOPS option.
date; time bash configure --with-jtreg=/cygdrive/c/java/binaries/jtreg-7.4+1 --with-gtest=/cygdrive/c/repos/googletest --with-boot-jdk=/cygdrive/c/java/binaries/jdk/x64/jdk-22.0.1+8 --openjdk-target=aarch64-unknown-cygwin --with-debug-level=slowdebug --with-extra-cflags=-DCHECK_UNHANDLED_OOPS

time /cygdrive/c/repos/scratchpad/scripts/java/cygwin/build-jdk.sh windows aarch64 0 slowdebug
Looking at the actual pointer, I noticed that its value is the data “cp1252..”. After further investigation, I conclude that the bug is that we’re calling oops::operator= instead of just copying the values! I test a fix that simply copies the values directly and it works! The test passes even with the -DCHECK_UNHANDLED_OOPS option!
On to the next question: is there anything else using the pd_conjoint_oops_atomic function (and will it be negatively affected by my change)? While searching for “pd_conjoint_oops_atomic”, I notice that some platforms have an assert that oops == long or smth like that. There are 2 users of pd_conjoint_oops_atomic:
One idea is to run Java programs on a build linked with /PROFILE (Performance Tools Profiler) i.e. configured via --with-extra-ldflags=-profile to enable collection of code coverage data then confirming that those functions are executed. That seems cumbersome though so I try to create some array copying code to see if I can get to those functions (using breakpoints but none are hit). After taking a break: I wonder if I can just search from the bottom instead? Looking in jvm.cpp for copy reveals the JVM_ArrayCopy function. Here is my Java program:
public class CopyArray {
    public static void main(String[] args) {
        int length = 0xdeadc0d;
        int srcPos = 0;

        if (args.length > 0) {
            try {
                int userLength = Integer.parseInt(args[0]);
                length = userLength;
            }
            catch (Throwable e) {
                System.err.println("Ignoring invalid user arguments.");
            }
        }

        byte[] src = new byte[length];

        for (int i = 0; i < src.length; i++) {
            src[i] = (byte)(i % 256);
        }
        byte[] dest = new byte[length];
        System.arraycopy(src, srcPos, dest, 0, length);
    }
}
I debugged the JVM running this program on my x64 machine. This hits the target function, JVM_ArrayCopy but there are so many callers. I have to set a condition on the breakpoint (hence the magic value of the length above) before I can step in to see where my call goes. Here are the source paths (note the different commit)
jvm.dll!Copy::pd_conjoint_bytes_atomic(const void * from, void * to, unsigned __int64 count) Line 119	C++
jvm.dll!Copy::conjoint_memory_atomic(const void * from, void * to, unsigned __int64 size) Line 53	C++
jvm.dll!AccessInternal::arraycopy_conjoint_atomic<void>(void * src, void * dst, unsigned __int64 length) Line 164	C++
jvm.dll!RawAccessBarrierArrayCopy::arraycopy<136585312,void>(arrayOop src_obj, unsigned __int64 src_offset_in_bytes, void * src_raw, arrayOop dst_obj, unsigned __int64 dst_offset_in_bytes, void * dst_raw, unsigned __int64 length) Line 298	C++
jvm.dll!RawAccessBarrier<136585312>::arraycopy<void>(arrayOop src_obj, unsigned __int64 src_offset_in_bytes, void * src_raw, arrayOop dst_obj, unsigned __int64 dst_offset_in_bytes, void * dst_raw, unsigned __int64 length) Line 308	C++
jvm.dll!AccessInternal::PreRuntimeDispatch::arraycopy<136587328,void>(arrayOop src_obj, unsigned __int64 src_offset_in_bytes, void * src_raw, arrayOop dst_obj, unsigned __int64 dst_offset_in_bytes, void * dst_raw, unsigned __int64 length) Line 834	C++
jvm.dll!AccessInternal::PreRuntimeDispatch::arraycopy<136585280,void>(arrayOop src_obj, unsigned __int64 src_offset_in_bytes, void * src_raw, arrayOop dst_obj, unsigned __int64 dst_offset_in_bytes, void * dst_raw, unsigned __int64 length) Line 867	C++
jvm.dll!AccessInternal::arraycopy_reduce_types<136585280,void>(arrayOop src_obj, unsigned __int64 src_offset_in_bytes, void * src_raw, arrayOop dst_obj, unsigned __int64 dst_offset_in_bytes, void * dst_raw, unsigned __int64 length) Line 1008	C++
jvm.dll!AccessInternal::arraycopy<136577024,void>(arrayOop src_obj, unsigned __int64 src_offset_in_bytes, const void * src_raw, arrayOop dst_obj, unsigned __int64 dst_offset_in_bytes, void * dst_raw, unsigned __int64 length) Line 1172	C++
jvm.dll!Access<136577024>::arraycopy<void>(arrayOop src_obj, unsigned __int64 src_offset_in_bytes, const void * src_raw, arrayOop dst_obj, unsigned __int64 dst_offset_in_bytes, void * dst_raw, unsigned __int64 length) Line 147	C++
jvm.dll!ArrayAccess<134217728>::arraycopy<void>(arrayOop src_obj, unsigned __int64 src_offset_in_bytes, arrayOop dst_obj, unsigned __int64 dst_offset_in_bytes, unsigned __int64 length) Line 301	C++
jvm.dll!TypeArrayKlass::copy_array(arrayOop s, int src_pos, arrayOop d, int dst_pos, int length, JavaThread * __the_thread__) Line 170	C++
jvm.dll!JVM_ArrayCopy(JNIEnv_ * env, _jclass * ignored, _jobject * src, int src_pos, _jobject * dst, int dst_pos, int length) Line 307	C++
00000244ea690702()	Unknown
Copy::conjoint_memory_atomic is interesting because it has a comment indicating that copying bytes is not aligned and so there is no need to be atomic. The if statements in that method indicate that I can change the size of elements in the array to call different paths. Looks like I need to create an array of objects.
/**
export JAVA_HOME=~/java/binaries/jdk/x64/jdk-21.0.2+13
$JAVA_HOME/bin/javac CopyArray.java
$JAVA_HOME/bin/java CopyArray
 */

public class CopyArray {
    public static void main(String[] args) {
        int length = 0xdead;
        int srcPos = 0;

        if (args.length > 0) {
            try {
                int userLength = Integer.parseInt(args[0]);
                length = userLength;
            }
            catch (Throwable e) {
                System.err.println("Ignoring invalid user arguments.");
            }
        }

        Object[] src = new Object[length];

        for (int i = 0; i < src.length; i++) {
            src[i] = new Object();
        }
        Object[] dest = new Object[length];
        System.arraycopy(src, srcPos, dest, 0, length);
    }
}
Now we are closer to the array_oops code I was trying to hit:
jvm.dll!Copy::pd_conjoint_jints_atomic(const int * from, int * to, unsigned __int64 count) Line 52	C++
jvm.dll!Copy::conjoint_oops_atomic(const narrowOop * from, narrowOop * to, unsigned __int64 count) Line 155	C++
jvm.dll!AccessInternal::arraycopy_conjoint_oops(narrowOop * src, narrowOop * dst, unsigned __int64 length) Line 54	C++
jvm.dll!RawAccessBarrierArrayCopy::arraycopy<50331750,HeapWordImpl *>(arrayOop src_obj, unsigned __int64 src_offset_in_bytes, HeapWordImpl * * src_raw, arrayOop dst_obj, unsigned __int64 dst_offset_in_bytes, HeapWordImpl * * dst_raw, unsigned __int64 length) Line 234	C++
jvm.dll!RawAccessBarrier<52715622>::arraycopy<enum narrowOop>(arrayOop src_obj, unsigned __int64 src_offset_in_bytes, narrowOop * src_raw, arrayOop dst_obj, unsigned __int64 dst_offset_in_bytes, narrowOop * dst_raw, unsigned __int64 length) Line 308	C++
jvm.dll!RawAccessBarrier<52715622>::oop_arraycopy<enum narrowOop>(arrayOop src_obj, unsigned __int64 src_offset_in_bytes, narrowOop * src_raw, arrayOop dst_obj, unsigned __int64 dst_offset_in_bytes, narrowOop * dst_raw, unsigned __int64 length) Line 130	C++
jvm.dll!ModRefBarrierSet::AccessBarrier<35938406,CardTableBarrierSet>::oop_arraycopy_in_heap<enum narrowOop>(arrayOop src_obj, unsigned __int64 src_offset_in_bytes, narrowOop * src_raw, arrayOop dst_obj, unsigned __int64 dst_offset_in_bytes, narrowOop * dst_raw, unsigned __int64 length) Line 109	C++
jvm.dll!AccessInternal::PostRuntimeDispatch<CardTableBarrierSet::AccessBarrier<35938406,CardTableBarrierSet>,8,35938406>::oop_access_barrier<HeapWordImpl *>(arrayOop src_obj, unsigned __int64 src_offset_in_bytes, HeapWordImpl * * src_raw, arrayOop dst_obj, unsigned __int64 dst_offset_in_bytes, HeapWordImpl * * dst_raw, unsigned __int64 length) Line 142	C++
jvm.dll!AccessInternal::RuntimeDispatch<35938374,HeapWordImpl *,8>::arraycopy(arrayOop src_obj, unsigned __int64 src_offset_in_bytes, HeapWordImpl * * src_raw, arrayOop dst_obj, unsigned __int64 dst_offset_in_bytes, HeapWordImpl * * dst_raw, unsigned __int64 length) Line 517	C++
jvm.dll!AccessInternal::PreRuntimeDispatch::arraycopy<35938374,HeapWordImpl *>(arrayOop src_obj, unsigned __int64 src_offset_in_bytes, HeapWordImpl * * src_raw, arrayOop dst_obj, unsigned __int64 dst_offset_in_bytes, HeapWordImpl * * dst_raw, unsigned __int64 length) Line 871	C++
jvm.dll!AccessInternal::arraycopy_reduce_types<35938372>(arrayOop src_obj, unsigned __int64 src_offset_in_bytes, HeapWordImpl * * src_raw, arrayOop dst_obj, unsigned __int64 dst_offset_in_bytes, HeapWordImpl * * dst_raw, unsigned __int64 length) Line 1018	C++
jvm.dll!AccessInternal::arraycopy<35913732,HeapWordImpl *>(arrayOop src_obj, unsigned __int64 src_offset_in_bytes, HeapWordImpl * const * src_raw, arrayOop dst_obj, unsigned __int64 dst_offset_in_bytes, HeapWordImpl * * dst_raw, unsigned __int64 length) Line 1172	C++
jvm.dll!Access<35913728>::oop_arraycopy<HeapWordImpl *>(arrayOop src_obj, unsigned __int64 src_offset_in_bytes, HeapWordImpl * const * src_raw, arrayOop dst_obj, unsigned __int64 dst_offset_in_bytes, HeapWordImpl * * dst_raw, unsigned __int64 length) Line 136	C++
jvm.dll!ArrayAccess<33554432>::oop_arraycopy(arrayOop src_obj, unsigned __int64 src_offset_in_bytes, arrayOop dst_obj, unsigned __int64 dst_offset_in_bytes, unsigned __int64 length) Line 327	C++
jvm.dll!ObjArrayKlass::do_copy(arrayOop s, unsigned __int64 src_offset, arrayOop d, unsigned __int64 dst_offset, int length, JavaThread * __the_thread__) Line 197	C++
jvm.dll!ObjArrayKlass::copy_array(arrayOop s, int src_pos, arrayOop d, int dst_pos, int length, JavaThread * __the_thread__) Line 282	C++
jvm.dll!JVM_ArrayCopy(JNIEnv_ * env, _jclass * ignored, _jobject * src, int src_pos, _jobject * dst, int dst_pos, int length) Line 307	C++
00000202d3f00502()	Unknown
00000202cc269950()	Unknown
In this call stack, the arraycopy_conjoint_oops(narrowOop* src, narrowOop* dst, size_t length) implementation that is called has narrow oops because of the branch in ObjArrayKlass::copy_array. Launch the application using these arguments instead:
Now the code block of interest is hit! Hmm, I’m realizing that I should have been explicit about the collector to use. This was debugging the G1 collector (chosen ergonomically).
jvm.dll!ZBarrierSet::AccessBarrier<52715590,ZBarrierSet>::oop_arraycopy_in_heap_no_check_cast(zpointer * dst, zpointer * src, unsigned __int64 length) Line 371	C++
jvm.dll!ZBarrierSet::AccessBarrier<35938374,ZBarrierSet>::oop_arraycopy_in_heap(arrayOop src_obj, unsigned __int64 src_offset_in_bytes, zpointer * src_raw, arrayOop dst_obj, unsigned __int64 dst_offset_in_bytes, zpointer * dst_raw, unsigned __int64 length) Line 403	C++
jvm.dll!ZBarrierSet::AccessBarrier<35938374,ZBarrierSet>::oop_arraycopy_in_heap(arrayOop src_obj, unsigned __int64 src_offset_in_bytes, oop * src_raw, arrayOop dst_obj, unsigned __int64 dst_offset_in_bytes, oop * dst_raw, unsigned __int64 length) Line 128	C++
jvm.dll!AccessInternal::PostRuntimeDispatch<ZBarrierSet::AccessBarrier<35938374,ZBarrierSet>,8,35938374>::oop_access_barrier<HeapWordImpl *>(arrayOop src_obj, unsigned __int64 src_offset_in_bytes, HeapWordImpl * * src_raw, arrayOop dst_obj, unsigned __int64 dst_offset_in_bytes, HeapWordImpl * * dst_raw, unsigned __int64 length) Line 142	C++
jvm.dll!AccessInternal::RuntimeDispatch<35938374,HeapWordImpl *,8>::arraycopy(arrayOop src_obj, unsigned __int64 src_offset_in_bytes, HeapWordImpl * * src_raw, arrayOop dst_obj, unsigned __int64 dst_offset_in_bytes, HeapWordImpl * * dst_raw, unsigned __int64 length) Line 517	C++
jvm.dll!AccessInternal::PreRuntimeDispatch::arraycopy<35938374,HeapWordImpl *>(arrayOop src_obj, unsigned __int64 src_offset_in_bytes, HeapWordImpl * * src_raw, arrayOop dst_obj, unsigned __int64 dst_offset_in_bytes, HeapWordImpl * * dst_raw, unsigned __int64 length) Line 871	C++
jvm.dll!AccessInternal::arraycopy_reduce_types<35938372>(arrayOop src_obj, unsigned __int64 src_offset_in_bytes, HeapWordImpl * * src_raw, arrayOop dst_obj, unsigned __int64 dst_offset_in_bytes, HeapWordImpl * * dst_raw, unsigned __int64 length) Line 1018	C++
jvm.dll!AccessInternal::arraycopy<35913732,HeapWordImpl *>(arrayOop src_obj, unsigned __int64 src_offset_in_bytes, HeapWordImpl * const * src_raw, arrayOop dst_obj, unsigned __int64 dst_offset_in_bytes, HeapWordImpl * * dst_raw, unsigned __int64 length) Line 1172	C++
jvm.dll!Access<35913728>::oop_arraycopy<HeapWordImpl *>(arrayOop src_obj, unsigned __int64 src_offset_in_bytes, HeapWordImpl * const * src_raw, arrayOop dst_obj, unsigned __int64 dst_offset_in_bytes, HeapWordImpl * * dst_raw, unsigned __int64 length) Line 136	C++
jvm.dll!ArrayAccess<33554432>::oop_arraycopy(arrayOop src_obj, unsigned __int64 src_offset_in_bytes, arrayOop dst_obj, unsigned __int64 dst_offset_in_bytes, unsigned __int64 length) Line 327	C++
jvm.dll!ObjArrayKlass::do_copy(arrayOop s, unsigned __int64 src_offset, arrayOop d, unsigned __int64 dst_offset, int length, JavaThread * __the_thread__) Line 198	C++
jvm.dll!ObjArrayKlass::copy_array(arrayOop s, int src_pos, arrayOop d, int dst_pos, int length, JavaThread * __the_thread__) Line 290	C++
jvm.dll!JVM_ArrayCopy(JNIEnv_ * env, _jclass * ignored, _jobject * src, int src_pos, _jobject * dst, int dst_pos, int length) Line 308	C++
000002602e8c06a8()	Unknown
I need to turn off compressed oops with the serial collector as well but it looks like there is no check_oop_function for the serial collector. That said, this exploration of array copying code was insightful, showing how the data type sizes determine which path is taken for copying primitives and objects. There didn’t appear to be any red flags about removing the oop::operator= usage so I opened 8334475: UnsafeIntrinsicsTest.java#ZGenerationalDebug assert(!assert_on_failure) failed: Has low-order bits set by swesonga · Pull Request #20390 · openjdk/jdk (github.com) to fix the assertion failure. The most interesting part of this investigation was that the bad address was a data value (cp1252) staring right at me and I missed it. This was quite educational for me though.
I was recently in a brainstorming session with a colleague about garbage collection scenarios. He suggested using mind mapping software, and I must confess that this was the first time I was hearing about this (as far as I can recall). We wanted a free program. Our search turned up freeplane (which can be downloaded on Sourceforge). As per my usual habits, I decided to build it from source myself (I especially get this urge when I run into Sourceforge download links). Fortunately, the sources are hosted on GitHub.
git clone https://github.com/freeplane/freeplane
Since this is a Java codebase, I searched for “eclipse java” to get an IDE. The Eclipse Packages page has the Eclipse IDE for Java Developers (I downloaded the Windows x64 version). The project uses gradle but I didn’t know how to open it in Eclipse so I asked Microsoft Copilot (Bing Chat) how to “open a gradle project in eclipse”. One of the results was from the Import existing Gradle Git project into Eclipse – Stack Overflow page, which points to the Buildship Gradle Integration plugin. I launched Eclipse, created a new workspace and tried to import the project but got an exception that ended with:
Caused by: java.lang.IllegalArgumentException: Unsupported class file major version 65
	at groovyjarjarasm.asm.ClassReader.<init>(ClassReader.java:199)
	at groovyjarjarasm.asm.ClassReader.<init>(ClassReader.java:180)
	at groovyjarjarasm.asm.ClassReader.<init>(ClassReader.java:166)
	at groovyjarjarasm.asm.ClassReader.<init>(ClassReader.java:287)
	... 180 more
I was not sure how to run the application. I had unloaded it and reloaded it. I asked copilot “how to run an imported gradle project in eclipse” and the last step is to right-click on the project and choose Refresh to ensure Eclipse recognizes the changes. This time, the project explorer folders are rearranged, and version numbers are appended after each project!
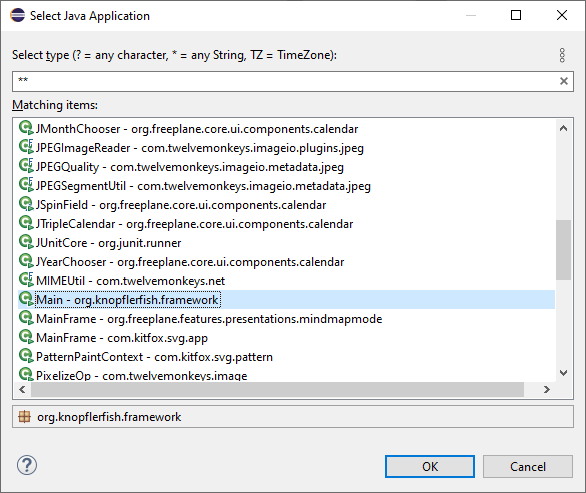
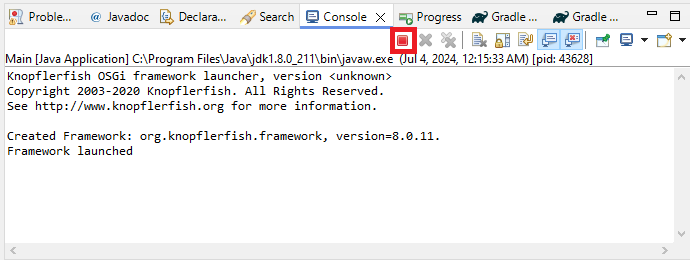
I right clicked on the freeplane project, selected Run As… Java Application, then chose the Main (org.knopflerfish.framework) application and clicked OK.
This text appeared in the console but no application Window appeared.
Knopflerfish OSGi framework launcher, version <unknown>
Copyright 2003-2020 Knopflerfish. All Rights Reserved.
See http://www.knopflerfish.org for more information.

Created Framework: org.knopflerfish.framework, version=8.0.11.
Framework launched
I was not even sure how to terminate the application so I asked copilot “how to stop a running java program in eclipse”. Yes, it has been that long. Forgot about this button.
I then downloaded freeplane_bin-1.11.14.zip to explore the UI and see if I could track down the strings from the menus… I found some resource files that but that was not helpful, so I continued exploring other projects. I finally stumbled into the freeplane_framework project. Clicking on “Run As… > Java Application” revealed that it has a Launcher project! I had been looking for a project like this. It failed with this error in the console window:
Exception in thread "main" java.lang.UnsupportedOperationException: The Security Manager is deprecated and will be removed in a future release
	at java.base/java.lang.System.setSecurityManager(System.java:430)
	at org.freeplane.launcher.Launcher.launchWithoutUICheck(Launcher.java:291)
	at org.freeplane.launcher.Launcher.main(Launcher.java:88)
I manually set the disableSecurityManager field to true to bypass this issue. The application finally launched!!
Launching Freeplane in Eclipse on macOS
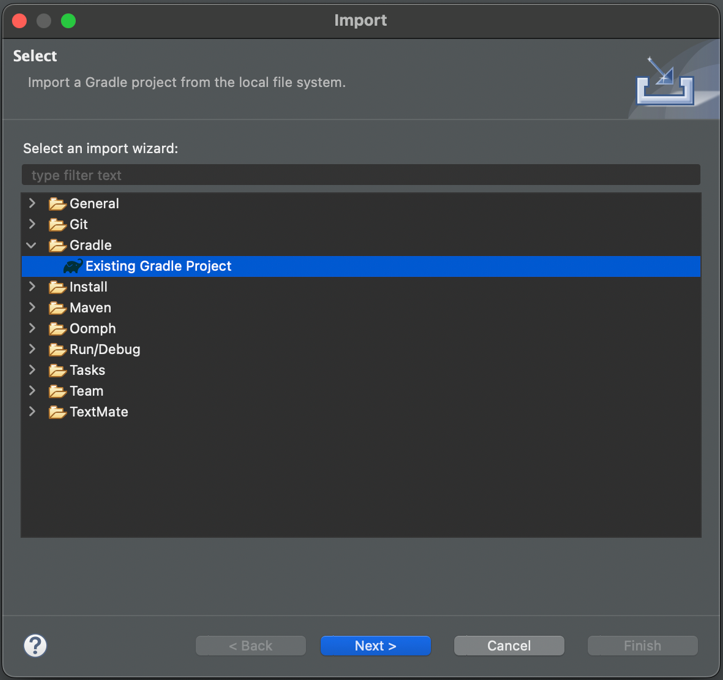
I decided to try this process on my M1 laptop. I downloaded the macOS AArch64 Eclipse IDE for Java Developers, accepted the default workspace path, and clicked on the “Import projects…” command in the package explorer. I selected the “Existing Gradle Project” import wizard then clicked Next.
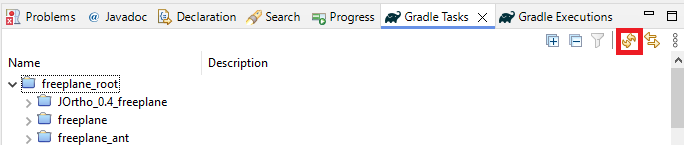
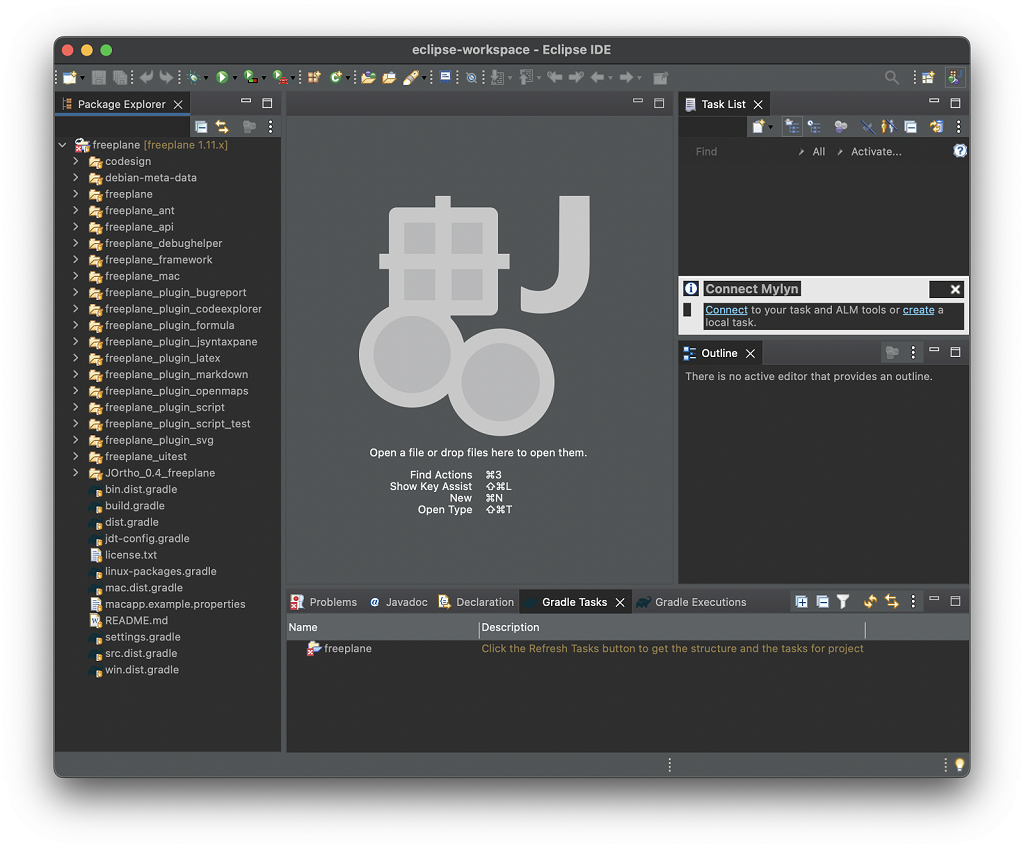
For the “Project root directory”, I browsed to the freeplane repo: /Users/saint/repos/freeplane then clicked on “Finish”. There is a helpful message in the Gradle Tasks pane (which shows up by default): Click on the Refresh Tasks button to get the structure and the tasks for project.
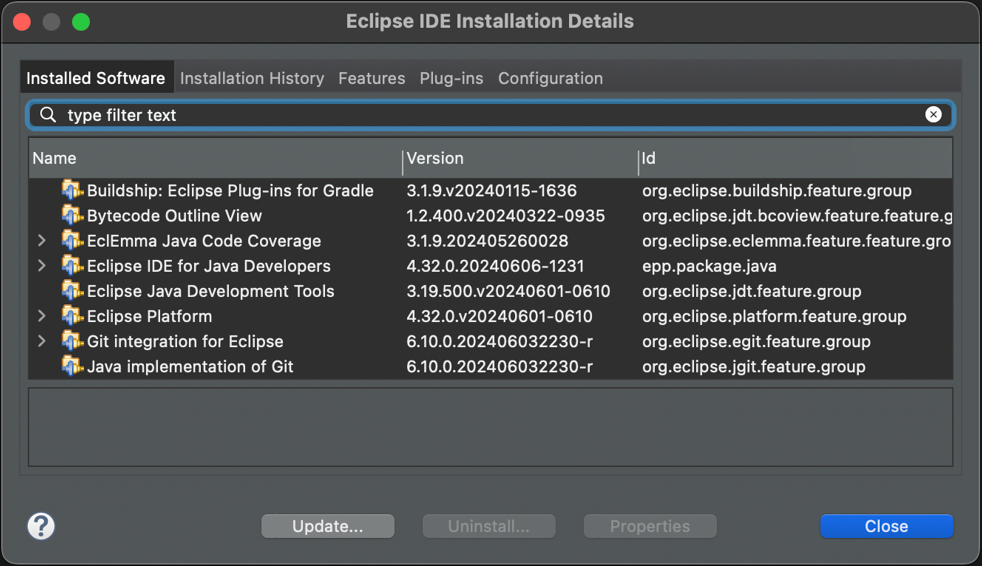
A message in the status bar flashed by fast but nothing else happened in the IDE. I confirmed that “Buildship: Eclipse Plug-ins for Gradle” was listed in the Installation Details (Eclipse > About Eclipse).
I didn’t have the console view of what could have happened though so I enabled it via Window > Show View > Console. Aha, looks like the same error that happened the first time in Windows (not even sure how that got resolved at this point).
FAILURE: Build failed with an exception.

* What went wrong:
Could not open cp_init generic class cache for initialization script '/Users/saint/eclipse-workspace/.metadata/.plugins/org.eclipse.buildship.core/init.d/eclipsePlugin.gradle' (/Users/saint/.gradle/caches/8.1.1/scripts/2to4is5l87jn9v7vrcgka57e).
> BUG! exception in phase 'semantic analysis' in source unit '_BuildScript_' Unsupported class file major version 65

* Try:
> Run with --stacktrace option to get the stack trace.
> Run with --info or --debug option to get more log output.
> Run with --scan to get full insights.

* Get more help at https://help.gradle.org

CONFIGURE FAILED in 568ms
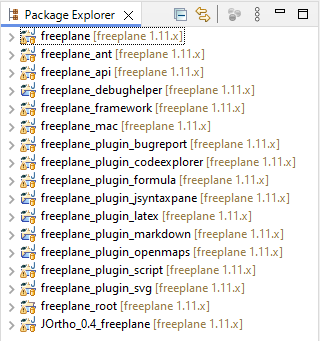
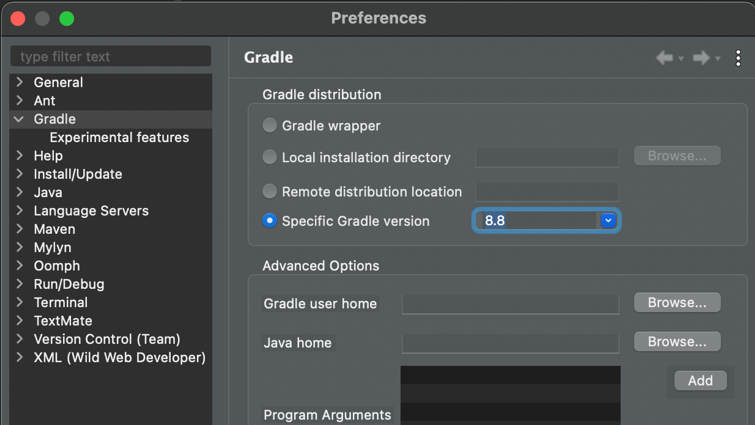
The Specific Gradle version dropdown has many options. I selected 8.8 then clicked on Apply and Close. Refreshing the Gradle Tasks still didn’t do anything. I closed the project and reopened it and now all the tasks showed up in the Gradle Tasks pane. However, the Run As option on the freeplane_framework project only had a Run Configurations… option. After some poking around, I discovered that just like on Windows, I need to expand the project, right click on the build.gradle file, then select the Gradle > Refresh Gradle Project to get the Package Explorer to refresh. This hides the top level files in the project. Now I could right click on the project and use the Run As > Java Application command. Selecting the “Launcher” Java application resulted in previously mentioned error message so I manually set the disableSecurityManager field to true. Freeplane finally launched successfully!
Summary: How to launch Freeplane in Eclipse
Clone the repo: git clone https://github.com/freeplane/freeplane
Set the gradle distribution to 8.8 (on Windows/Linux, use Window > Preferences, on macOS, use Eclipse > Preferences).
Click on Import projects… in the Package Explorer.
Select Existing Gradle Project then browse to the repo for the “Project root directory” (you can click Next to override the workspace settings to choose a specific Gradle version).
Click on Refresh Gradle Tasks.
Right click on the root build.gradle file and click on Refresh Tasks (if necessary, i.e. this file is shown at the root level of the package explorer)
Manually set the disableSecurityManager field to true to bypass the UnsupportedOperationException.
Run the “build” Gradle task in the Gradle Tasks window.
Right click on the freeplane_framework project, Run As > Java Application then select the Launcher application.
Select the freeplane dist option in the “Select Java Application” Window and click OK.
To build and run the JMH benchmark, ensure Maven is installed (the mvn command should be available in the shell). On Ubuntu, this is as easy as running sudo apt install maven then setting up JMH using the steps below.
git clone https://github.com/swesonga/benchmarks
cd benchmarks
cd java/jmh
./setup_jmh_jdk_micros.sh
./run_jmh_jdk_micros.sh Parallel 1 2 10 5 5
The setup_jmh_jdk_micros.sh script builds the JMH JDK microbenchmarks and the run_jmh_jdk_micros.sh run the benchmark. Someone recently asked why there are 2 java processes shown in top when the run_jmh_jdk_micros.sh script runs given that it launches only 1 java process. I learned from this site how to use top to see java processes only: run top, type ‘o’, then type ‘COMMAND=java’ and press ENTER. This is the resulting output from the top command:
top - 22:15:21 up  8:15,  1 user,  load average: 1.73, 0.66, 0.30
Tasks: 330 total,   1 running, 329 sleeping,   0 stopped,   0 zombie
%Cpu(s): 20.9 us,  0.6 sy,  0.0 ni, 78.3 id,  0.0 wa,  0.0 hi,  0.2 si,  0.0 st
MiB Mem :  15415.5 total,   5837.9 free,   5436.0 used,   4141.6 buff/cache
MiB Swap:   2048.0 total,   2048.0 free,      0.0 used.   9568.6 avail Mem

    PID USER      PR  NI    VIRT    RES    SHR S  %CPU  %MEM     TIME+ COMMAND
  22007 saint     20   0 5009436   1.1g  22464 S 345.3   7.2   1:02.74 java
  21927 saint     20   0 5607592   1.1g  23100 S   0.3   7.2   0:01.08 java
Sure enough, there are 2 java processes, each with 1.1g RES. This can also be confirmed by running the ps -aux | grep java command.
Notice that one of the processes has an IP address and what is most likely a port number. Without knowing anything else, this would suggest a client/server model in use. To better understand why there are 2 java processes, let us see look at how the run script launches Java. It passes flags like -f 1 to the benchmark jar file. What parses these flags?
The benchmark JAR file is created from a pom.xml file containing a mainClass attribute of org.openjdk.jmh.Main. That’s the class responsible for parsing these flags. This Main class uses the CommandLineOptions class to parse arguments like -f 1 then executes the Runner.run() method. Runner.runBenchmarks() checks whether the benchmarks should be run embedded or forked. runBenchmarksEmbedded() has a warning about using non-forked runs only for debugging purposes. This answers the question of why there are 2 JVMs: we are running in forked mode. runSeparate() has a getForkedMainCommand() method, which suggests that there is most likely a way to pass custom arguments to the ForkedMain JVM.
Now that we understand why there are 2 JVMs, can we control the heap size of each of them independently? The CommandLineOptions class has a list of all the supported arguments. Notice the jvmArgs, jvmArgsAppend, and jvmArgsAppend arguments! These suggest that we can indeed control the heap sizes of each of the JVMs. Use the jvmArgsAppend flag in the run_jmh_jdk_micros.sh script (e.g. just before the benchmark_filter_regex to specify a custom heap size for the forked java process (independent of the jvm_heap_size_opts).
Installing Maven
I did not have Java set up on my Ubuntu VM. Therefore, setting up MVN installed Java and many other dependencies. I decided to list these here for future reference.
saint@vm1ubuntu:~/java$ sudo apt install maven
Reading package lists... Done
Building dependency tree... Done
Reading state information... Done
The following additional packages will be installed:
  ca-certificates-java default-jre-headless java-common libaopalliance-java libapache-pom-java libatinject-jsr330-api-java libcdi-api-java libcommons-cli-java
  libcommons-io-java libcommons-lang3-java libcommons-parent-java libgeronimo-annotation-1.3-spec-java libgeronimo-interceptor-3.0-spec-java libguava-java
  libguice-java libhawtjni-runtime-java libjansi-java libjansi-native-java libjsr305-java libmaven-parent-java libmaven-resolver-java libmaven-shared-utils-java
  libmaven3-core-java libplexus-cipher-java libplexus-classworlds-java libplexus-component-annotations-java libplexus-interpolation-java libplexus-sec-dispatcher-java
  libplexus-utils2-java libsisu-inject-java libsisu-plexus-java libslf4j-java libwagon-file-java libwagon-http-shaded-java libwagon-provider-api-java
  openjdk-11-jre-headless
Suggested packages:
  default-jre libaopalliance-java-doc libatinject-jsr330-api-java-doc libel-api-java libcommons-io-java-doc libcommons-lang3-java-doc libasm-java libcglib-java
  libjsr305-java-doc libmaven-shared-utils-java-doc liblogback-java libplexus-classworlds-java-doc libplexus-sec-dispatcher-java-doc libplexus-utils2-java-doc junit4
  testng libcommons-logging-java liblog4j1.2-java fonts-dejavu-extra fonts-ipafont-gothic fonts-ipafont-mincho fonts-wqy-microhei | fonts-wqy-zenhei
The following NEW packages will be installed:
  ca-certificates-java default-jre-headless java-common libaopalliance-java libapache-pom-java libatinject-jsr330-api-java libcdi-api-java libcommons-cli-java
  libcommons-io-java libcommons-lang3-java libcommons-parent-java libgeronimo-annotation-1.3-spec-java libgeronimo-interceptor-3.0-spec-java libguava-java
  libguice-java libhawtjni-runtime-java libjansi-java libjansi-native-java libjsr305-java libmaven-parent-java libmaven-resolver-java libmaven-shared-utils-java
  libmaven3-core-java libplexus-cipher-java libplexus-classworlds-java libplexus-component-annotations-java libplexus-interpolation-java libplexus-sec-dispatcher-java
  libplexus-utils2-java libsisu-inject-java libsisu-plexus-java libslf4j-java libwagon-file-java libwagon-http-shaded-java libwagon-provider-api-java maven
  openjdk-11-jre-headless
0 upgraded, 37 newly installed, 0 to remove and 72 not upgraded.
Need to get 52.7 MB of archives.
After this operation, 189 MB of additional disk space will be used.
Do you want to continue? [Y/n]
Let us try using JITWatch on the sample Factorization program I have been using to learn about systems performance. Use these instructions from that blog post to get JITWatch:
git clone https://github.com/AdoptOpenJDK/jitwatch.git
cd jitwatch
mvn clean package
# Produces an executable jar in ui/target/jitwatch-ui-shaded.jar

java -jar ui/target/jitwatch-ui-shaded.jar
Start the factorization sample application such that a hotspot log file is generated. To do so, use the flags listed in the JITWatch Instructions · AdoptOpenJDK/jitwatch Wiki (github.com). I decide to redirect the output to a file to avoid filling the script with the additional logging output.
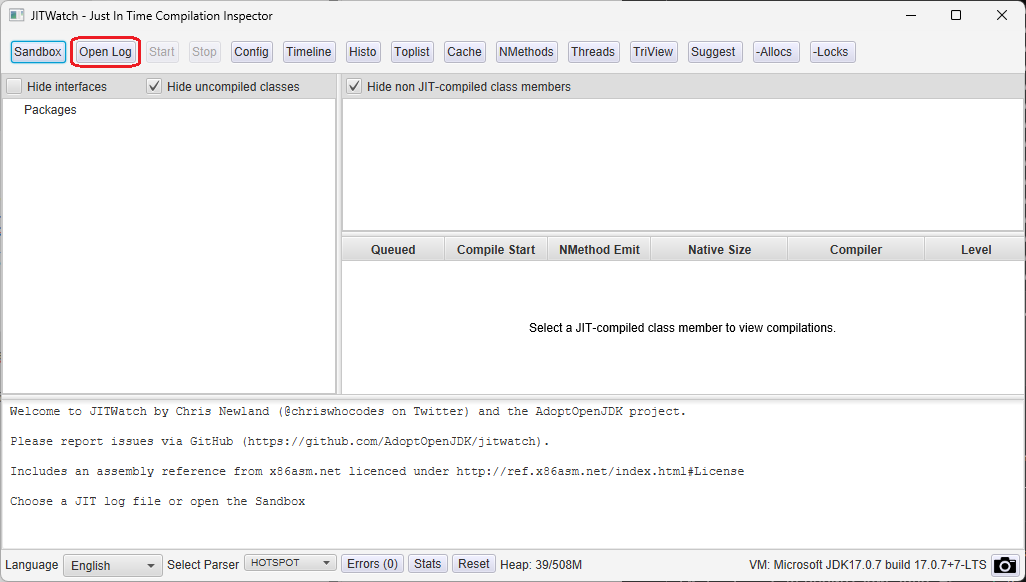
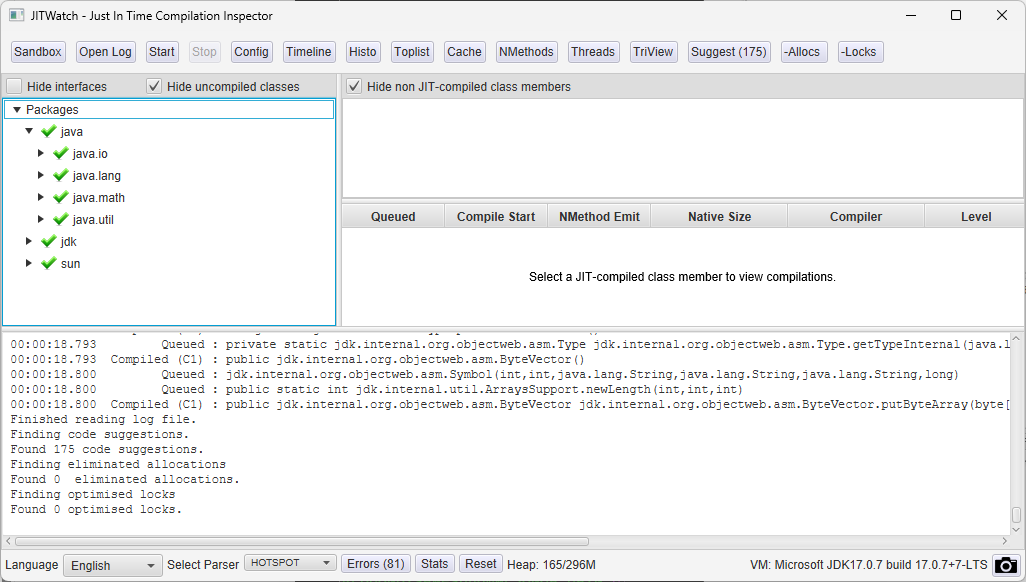
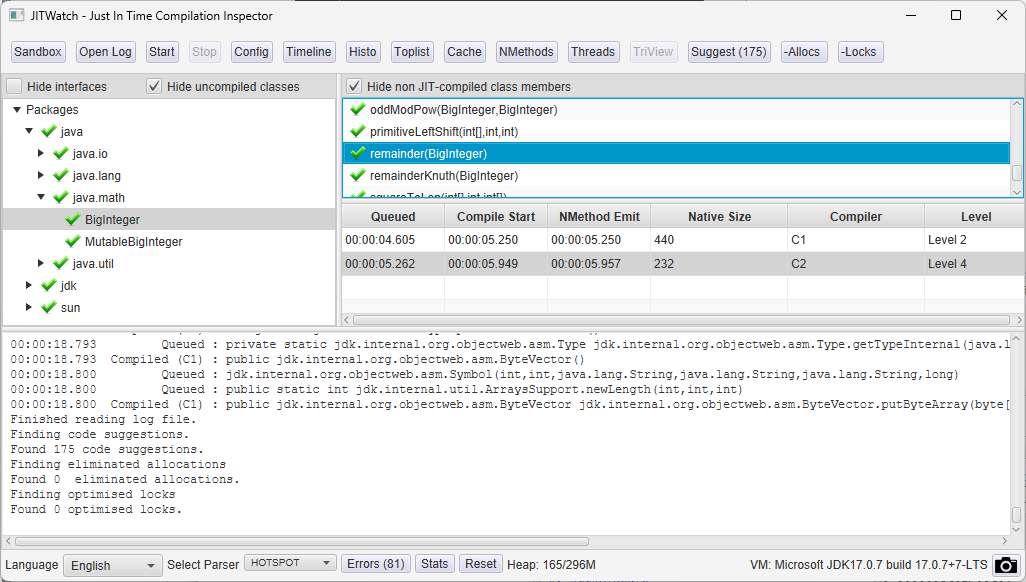
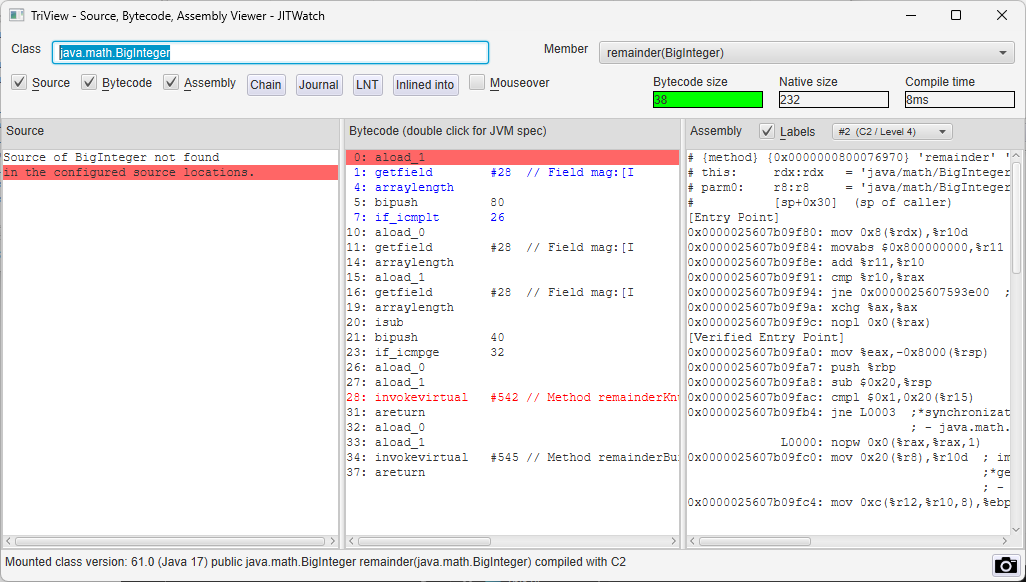
Click on the “Open Log” button in JITWatch then select the hotspot*.log file. Next, click on the Start button to process the JIT log.
Opening a HotSpot Log FileProcessed HotSpot LogViewing JIT-compiled Class Members
Clicking on a class member opens another window with the corresponding assembly instructions generated by the JIT. I haven’t set up any source code locations but the assembly instructions are still displayed.
Setting up MVN on Windows
To run JITWatch on Windows, download the Maven binaries from Maven – Download Apache Maven and verify the hashes using certutil. Extract the downloaded .zip file using tar. Here are the instructions I used in Git Bash.
mkdir -p /c/java/binaries/apache
cd /c/java/binaries/apache

curl -Lo apache-maven-3.9.3-bin.zip https://dlcdn.apache.org/maven/maven-3/3.9.3/binaries/apache-maven-3.9.3-bin.zip

certutil -hashfile apache-maven-3.9.3-bin.zip SHA512
# shasum -a 512 apache-maven-3.9.3-bin.zip

tar xf apache-maven-3.9.3-bin.zip
I have been studying the performance of a simple Java application (for integer factorization) using async-profiler. The application’s source code is on GitHub.
async-profiler is a low overhead sampling profiler for Java that does not suffer from Safepoint bias problem.
Once the application is running, use the profiler.sh script to attach to the Java process and start profiling it. I was interested in wall clock profiling. This is specified using the -e wall argument (see Part 2: Improving Performance with Async-profiler by Andrei Pangin. – YouTube). The command line below will profile the Java application with a 5ms sampling interval for a duration (-d) of 10 seconds.
# macos:
cd ~/java/binaries/async-profiler-2.9-macos

# Linux:
cd ~/java/binaries/async-profiler-2.9-linux

./profiler.sh -e wall -t -i 5ms -d 10 -f result.html jps
The jps argument above lets the profiler.sh script determine which Java process is running by calling The jps Command (oracle.com). If there are multiple Java processes, then run jps first to determine the process id of the one to be profiled then explicitly pass that pid to profiler.sh e.g.
To find out file types on macos, run file -I rawdata. In my case, I had flamegraph data that was shared as application/gzip (causing unzip to fail with End-of-central-directory signature not found. I needed to use gzip -d rawdata.
We use SymChk to ensure that symbols are available for Windows applications. For the OpenJDK build, this command line can be used to ensure the symbols directory contains symbols for all the Java binaries:
/r causes SymChk to recursively search all subdirectories under the D:\java\binaries\jdk\x64\jdk-17.0.7+7\ directory for program files.
/s specifies the directories containing symbols and multiple directories should be separated with semicolons
Here’s the tail end of the SymChk output:
...
SYMCHK: api-ms-win-crt-utility-l1-1-0.dll FAILED  - api-ms-win-crt-utility-l1-1-0.pdb mismatched or not found
SYMCHK: msvcp140.dll         FAILED  - msvcp140.amd64.pdb mismatched or not found
SYMCHK: ucrtbase.dll         FAILED  - ucrtbase.pdb mismatched or not found
SYMCHK: vcruntime140.dll     FAILED  - vcruntime140.amd64.pdb mismatched or not found
SYMCHK: vcruntime140_1.dll   FAILED  - vcruntime140_1.amd64.pdb mismatched or not found

SYMCHK: FAILED files = 46
SYMCHK: PASSED + IGNORED files = 440
The components that have failures are binaries that are external dependencies of the OpenJDK. Those failures can therefore be safely ignored. An interesting thing to note is that java.dll and java.exe are in the same folder in the OpenJDK installation. Since their symbol files are both called java.pdb, the symbols for java.exe are placed in a subdirectory called exe. This applies to other binaries with similar PDB filename conflicts. See the Symbol Path Syntax section for more details.
One of my colleagues shared this simple Java program with me.
import java.io.IOException;
import java.io.RandomAccessFile;
import java.nio.channels.FileChannel;

public class TruncateFile {
    public static void main(String[] args) throws IOException {
        RandomAccessFile file = new RandomAccessFile("data.txt", "rw");
        FileChannel channel = file.getChannel();
        channel.map(FileChannel.MapMode.READ_WRITE, 0, 10);
        channel.truncate(9);
    }
}
This program can be launched using source-file mode for convenience: /c/java/binaries/jdk/x64/jdk-19.0.1+10/bin/java.exe TruncateFile.java. It failed with the exception below:
Exception in thread "main" java.io.IOException: The requested operation cannot be performed on a file with a user-mapped section open
        at java.base/sun.nio.ch.FileDispatcherImpl.truncate0(Native Method)
        at java.base/sun.nio.ch.FileDispatcherImpl.truncate(FileDispatcherImpl.java:90)
        at java.base/sun.nio.ch.FileChannelImpl.truncate(FileChannelImpl.java:490)
        at TruncateFile.main(TruncateFile.java:10)
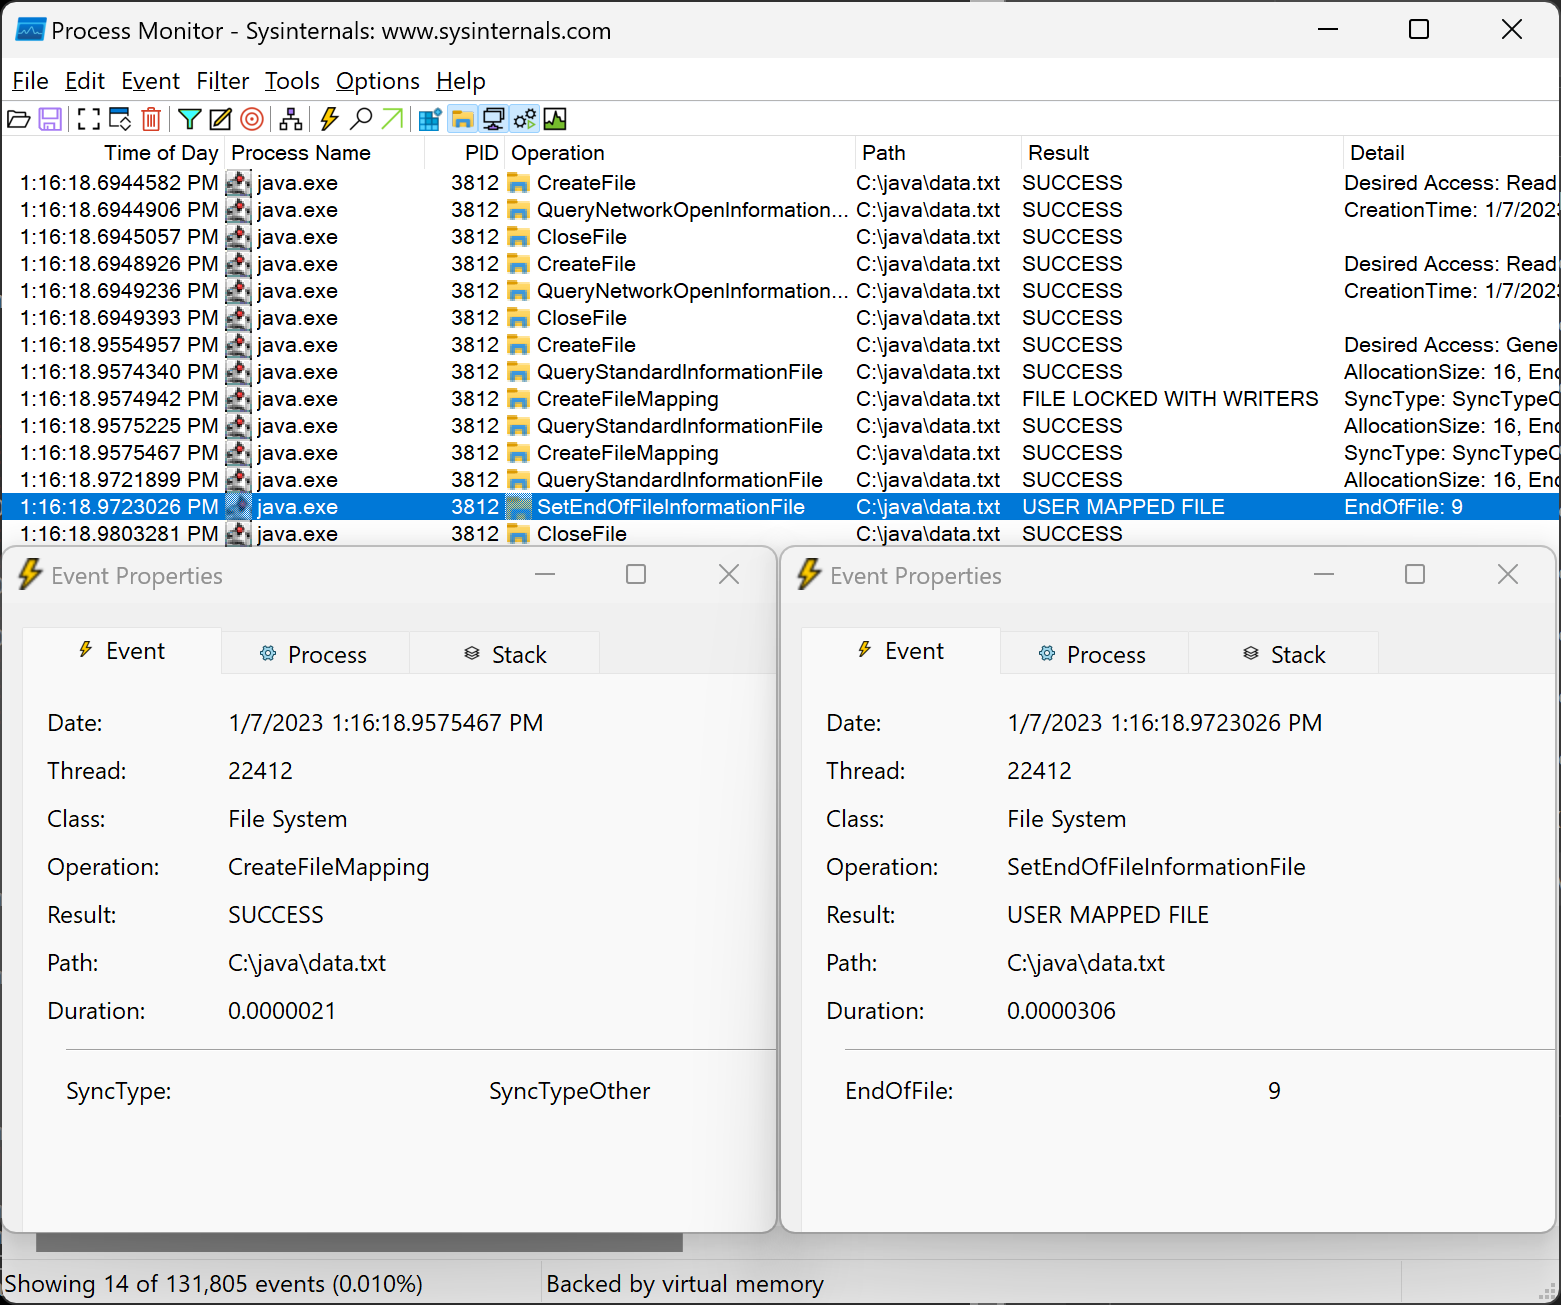
Why does it fail on Windows? I launched Process Monitor, started capturing events, and then ran the above java.exe command and finally stopped capturing events. The SetFileInformationByHandle function failed as indicated by the USER MAPPED FILE entry in its result column.
Process Monitor File Truncation Events
I created a Windows console application, TruncateFile, to also map a file and truncate it using the SetFileInformationByHandle function and therefore get some insight into whether this behavior is the result of a Java bug. Mapping the file using the CreateFileMappingW function indeed fails with ERROR_USER_MAPPED_FILE (The requested operation cannot be performed on a file with a user-mapped section open). This does appear to be a Windows limitation. It is likely the issue another user ran into at Memory mapped file truncation on windows – Stack Overflow.
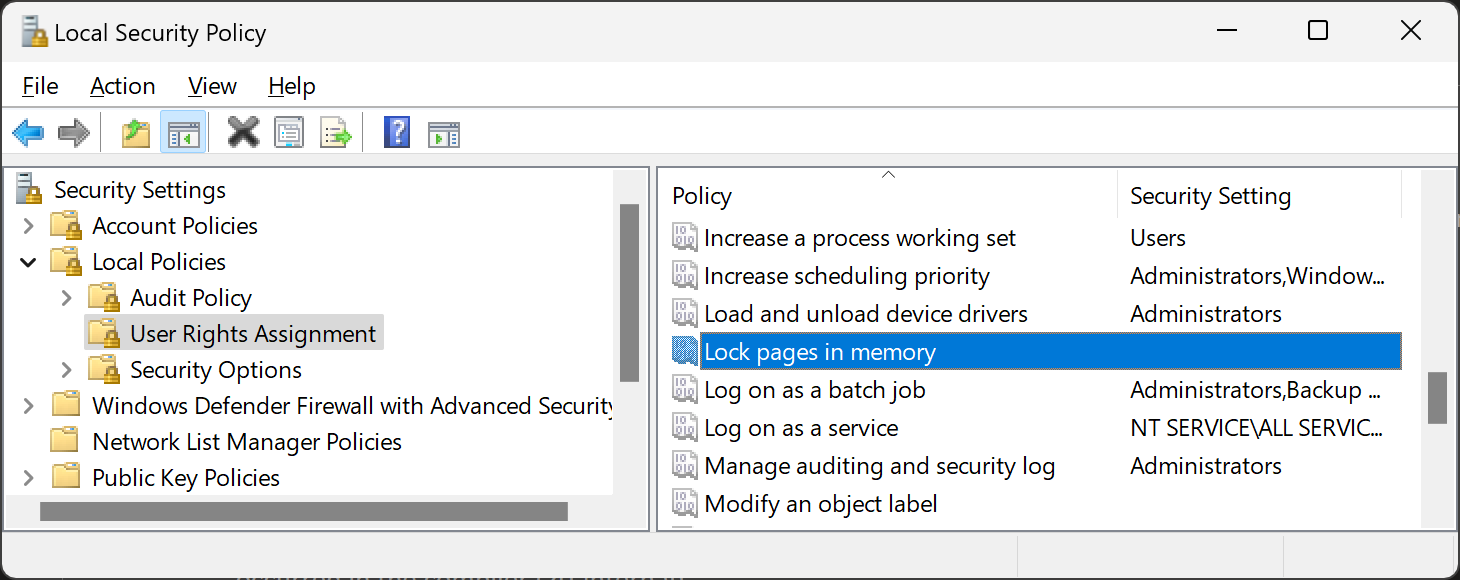
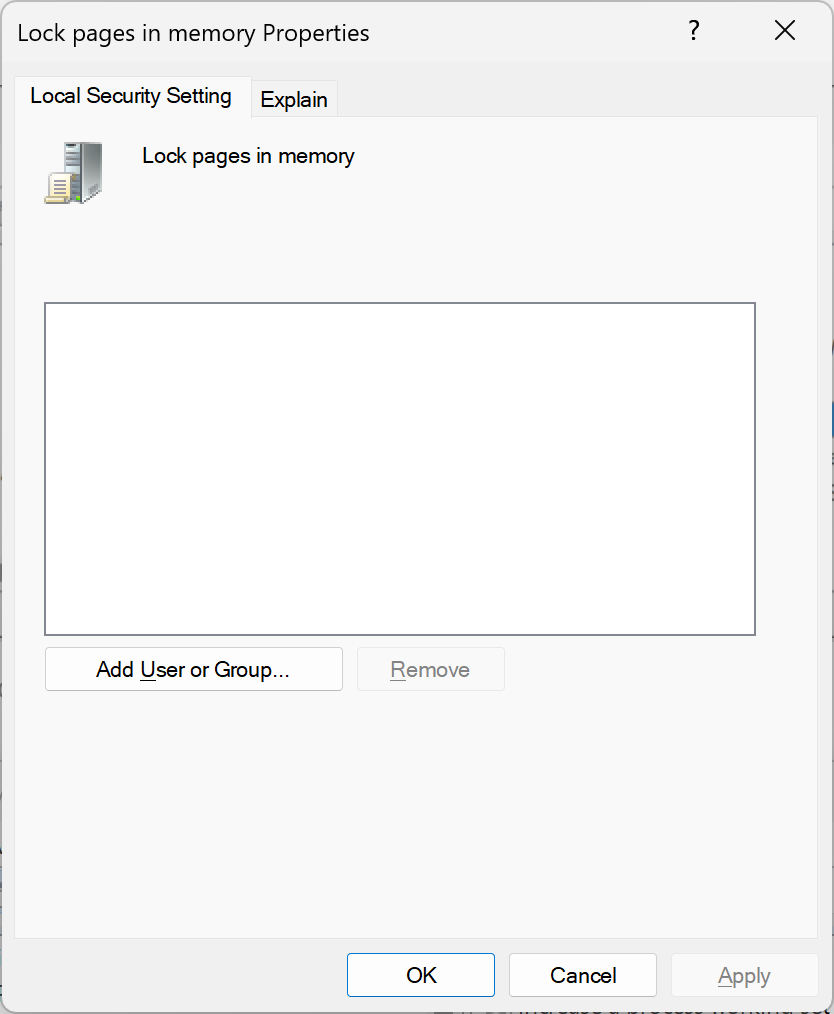
The reason for the error is that the Lock pages in memory policy did not have any allowed users. As documented at AdjustTokenPrivileges, use the Local Security Policy app to change the security policy.
Lock Pages in Memory Security Policy
Adding a User to the “Lock pages in memory” policy
The output I got once the privilege issue was addressed is in the snippet below. To find these message in the source code, run grep -Rin --include *.cpp "Failed to reserve and commit" ./src/.
OpenJDK 64-Bit Server VM warning: Failed to reserve and commit memory using large pages. req_addr: 0x0000000000000000 bytes: 251658240
[0.249s][info][gc,init] CardTable entry size: 512
OpenJDK 64-Bit Server VM warning: Failed to reserve and commit memory using large pages. req_addr: 0x0000000600000000 bytes: 8589934592
OpenJDK 64-Bit Server VM warning: Failed to reserve and commit memory using large pages. req_addr: 0x0000000000000000 bytes: 134217728
OpenJDK 64-Bit Server VM warning: Failed to reserve and commit memory using large pages. req_addr: 0x0000000000000000 bytes: 134217728
[0.374s][info][gc,init] Version: 19.0.1+10 (release)
[0.375s][info][gc,init] CPUs: 12 total, 12 available
[0.375s][info][gc,init] Memory: 32487M
[0.375s][info][gc,init] Large Page Support: Enabled
[0.376s][info][gc,init] NUMA Support: Disabled
[0.376s][info][gc,init] Compressed Oops: Enabled (Zero based)
[0.376s][info][gc,init] Heap Region Size: 4M
[0.377s][info][gc,init] Heap Min Capacity: 8G
[0.377s][info][gc,init] Heap Initial Capacity: 8G
[0.377s][info][gc,init] Heap Max Capacity: 8G
[0.378s][info][gc,init] Pre-touch: Disabled
[0.378s][info][gc,init] Parallel Workers: 10
[0.378s][info][gc,init] Concurrent Workers: 3
[0.379s][info][gc,init] Concurrent Refinement Workers: 10
[0.379s][info][gc,init] Periodic GC: Disabled
openjdk 19.0.1 2022-10-18
OpenJDK Runtime Environment Temurin-19.0.1+10 (build 19.0.1+10)
OpenJDK 64-Bit Server VM Temurin-19.0.1+10 (build 19.0.1+10, mixed mode, sharing)
Here is the call stack where the actual memory reservation happens (the call to the VirtualAlloc function):
jvm.dll!virtualAlloc(void * lpAddress, unsigned __int64 dwSize, unsigned long flAllocationType, unsigned long flProtect)	C++
jvm.dll!reserve_large_pages_single_range(unsigned __int64 size, char * req_addr, bool exec)	C++
jvm.dll!reserve_large_pages(unsigned __int64 size, char * req_addr, bool exec)	C++
jvm.dll!os::pd_reserve_memory_special(unsigned __int64 bytes, unsigned __int64 alignment, unsigned __int64 page_size, char * addr, bool exec)	C++
jvm.dll!os::reserve_memory_special(unsigned __int64 size, unsigned __int64 alignment, unsigned __int64 page_size, char * addr, bool executable)	C++
jvm.dll!reserve_memory_special(char * requested_address, const unsigned __int64 size, const unsigned __int64 alignment, const unsigned __int64 page_size, bool exec)	C++
jvm.dll!ReservedSpace::reserve(unsigned __int64 size, unsigned __int64 alignment, unsigned __int64 page_size, char * requested_address, bool executable)	C++
jvm.dll!ReservedSpace::initialize(unsigned __int64 size, unsigned __int64 alignment, unsigned __int64 page_size, char * requested_address, bool executable)	C++
jvm.dll!ReservedCodeSpace::ReservedCodeSpace(unsigned __int64 r_size, unsigned __int64 rs_align, unsigned __int64 rs_page_size)	C++
jvm.dll!CodeCache::reserve_heap_memory(unsigned __int64 size)	C++
jvm.dll!CodeCache::initialize_heaps()	C++
jvm.dll!CodeCache::initialize()	C++
jvm.dll!codeCache_init()	C++
jvm.dll!init_globals()	C++
jvm.dll!Threads::create_vm(JavaVMInitArgs * args, bool * canTryAgain)	C++
jvm.dll!JNI_CreateJavaVM_inner(JavaVM_ * * vm, void * * penv, void * args)	C++
jvm.dll!JNI_CreateJavaVM(JavaVM_ * * vm, void * * penv, void * args)	C++
jli.dll!InitializeJVM(const JNIInvokeInterface_ * * * pvm, const JNINativeInterface_ * * * penv, InvocationFunctions * ifn)	C
jli.dll!JavaMain(void * _args)	C
jli.dll!ThreadJavaMain(void * args)	C
The virtualAlloc function uses a logging wrapper to capture and log the result of the VirtualAlloc Windows function. It uses a separate logging tag (os). To capture both OS and pagesize logs to disk, use this command:
Here’s a snippet of the beginning of pagesize.txt.
[0.070s][trace][pagesize] Attempt special mapping: size: 240M, alignment: 2M
[0.071s][debug][pagesize] Reserving large pages in a single large chunk.
[0.320s][info ][pagesize] CodeHeap 'non-nmethods':  min=4M max=6M base=0x000002a9c5c00000 page_size=2M size=6M
[0.320s][info ][pagesize] CodeHeap 'profiled nmethods':  min=4M max=116M base=0x000002a9be800000 page_size=2M size=116M
[0.320s][info ][pagesize] CodeHeap 'non-profiled nmethods':  min=4M max=118M base=0x000002a9c6200000 page_size=2M size=118M
[0.324s][trace][pagesize] Attempt special mapping: size: 8G, alignment: 4M
[0.324s][debug][pagesize] Reserving large pages in a single large chunk.
[0.948s][info ][pagesize] Heap:  min=8G max=8G base=0x0000000600000000 page_size=4K size=8G
And below is the beginning of the os.txt log. Notice that the arguments to VirtualAlloc are logged, as well as its return value and the error code when a failure occurs. For example, the 2nd-to-last line shows that the 8GB allocation with large pages failed with error code 1450 (ERROR_NO_SYSTEM_RESOURCES aka Insufficient system resources exist to complete the requested service).
[0.052s][debug][os] Initial active processor count set to 12
[0.059s][trace][os] VirtualAlloc(0x0000000000000000, 8192, 2000, 4) returned 0x000002a9b5c60000.
[0.060s][trace][os] VirtualAlloc(0x000002a9b5c60000, 8192, 1000, 4) returned 0x000002a9b5c60000.
[0.060s][info ][os] SafePoint Polling address, bad (protected) page:0x000002a9b5c60000, good (unprotected) page:0x000002a9b5c61000
[0.065s][trace][os] VirtualAlloc(0x000000bc22600000, 16384, 1000, 4) returned 0x000000bc22600000.
[0.066s][info ][os] attempting shared library load of C:\java\binaries\jdk\x64\jdk-19.0.1+10\bin\java.dll
[0.069s][info ][os] shared library load of C:\java\binaries\jdk\x64\jdk-19.0.1+10\bin\java.dll was successful
[0.319s][trace][os] VirtualAlloc(0x0000000000000000, 251658240, 20003000, 40) returned 0x000002a9be800000.
[0.320s][trace][os] VirtualAlloc(0x0000000000000000, 65536, 2000, 4) returned 0x000002a9b5c80000.
[0.320s][trace][os] VirtualAlloc(0x000002a9b5c80000, 32768, 1000, 4) returned 0x000002a9b5c80000.
[0.320s][trace][os] VirtualAlloc(0x0000000000000000, 983040, 2000, 4) returned 0x000002a9b5c90000.
[0.320s][trace][os] VirtualAlloc(0x000002a9b5c90000, 32768, 1000, 4) returned 0x000002a9b5c90000.
[0.320s][trace][os] VirtualAlloc(0x0000000000000000, 983040, 2000, 4) returned 0x000002a9b5d80000.
[0.320s][trace][os] VirtualAlloc(0x000002a9b5d80000, 32768, 1000, 4) returned 0x000002a9b5d80000.
[0.944s][info ][os] VirtualAlloc(0x0000000600000000, 8589934592, 20003000, 4) failed (1450).
[0.947s][trace][os] VirtualAlloc(0x0000000600000000, 8589934592, 2000, 4) returned 0x0000000600000000.
The JBS bug made it sound like this feature worked in JDK 17 so I ran the same command using JDK 17.0.5.