The Microsoft.CodeCoverage.Console tool can be used to collect code coverage for C++ code. To use it, open the “Developer Command Prompt” – it should be in the path by default. Once the OpenJDK build completes, instrument the DLLs and EXEs as follows:
Run start output.coverage to open the code coverage file. You can use the search filter to narrow down the coverage results, e.g. by searching for “interpreter”.
Instrumenting Fails on Windows AArch64
There are warnings when instrumenting some of the DLLs on the AArch64 platform. The warning below is from running Microsoft.CodeCoverage.Console instrument java.dll in the ARM64 Native Tools Command Prompt:
My list from last year had these 3 files, which are no longer present in the build so keep in mind that you need to ensure your list is current and exhaustive:
$ alias ls
alias ls='ls -F --color=auto --show-control-chars'

$ which ls
/usr/bin/ls

$ /usr/bin/ls -1 *.exe
jabswitch.exe
jaccessinspector.exe
jaccesswalker.exe
...
When Experimenting with perf on Linux, I used an Ubuntu VM. This can be a bit more cumbersome when simply trying to understand what various Linux commands can do. I decided to try using WSL to experiment with perf. Running wsl from the command line was sufficient to determine how to install the Ubuntu distribution.
C:\dev> wsl
Windows Subsystem for Linux has no installed distributions.
Distributions can be installed by visiting the Microsoft Store:
https://aka.ms/wslstore
C:\dev> wsl --install
Windows Subsystem for Linux is already installed.
The following is a list of valid distributions that can be installed.
Install using 'wsl --install -d <Distro>'.
NAME FRIENDLY NAME
Ubuntu Ubuntu
Debian Debian GNU/Linux
kali-linux Kali Linux Rolling
Ubuntu-18.04 Ubuntu 18.04 LTS
Ubuntu-20.04 Ubuntu 20.04 LTS
Ubuntu-22.04 Ubuntu 22.04 LTS
OracleLinux_7_9 Oracle Linux 7.9
OracleLinux_8_7 Oracle Linux 8.7
OracleLinux_9_1 Oracle Linux 9.1
SUSE-Linux-Enterprise-Server-15-SP4 SUSE Linux Enterprise Server 15 SP4
openSUSE-Leap-15.4 openSUSE Leap 15.4
openSUSE-Tumbleweed openSUSE Tumbleweed
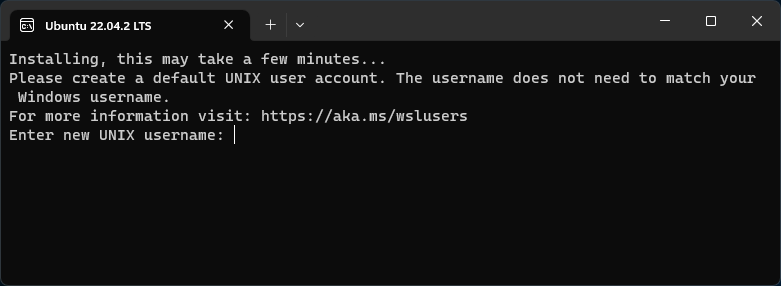
C:\dev> wsl --install -d Ubuntu-22.04
Installing: Ubuntu 22.04 LTS
Ubuntu 22.04 LTS has been installed.
Launching Ubuntu 22.04 LTS...
Creating a UNIX user account
Installing perf
Install the linux-tools-generic package then check the perf version as follows:
Once the WSL Ubuntu distro installation completed and I have created a user account, I start by checking the perf --version lets you know how it can be installed:
saint@machine:~$ perf --version
Command 'perf' not found, but can be installed with:
sudo apt install linux-intel-iotg-tools-common    # version 5.15.0-1027.32, or
sudo apt install linux-nvidia-tools-common        # version 5.15.0-1023.23
sudo apt install linux-tools-common               # version 5.15.0-71.78
sudo apt install linux-nvidia-5.19-tools-common   # version 5.19.0-1009.9
sudo apt install linux-nvidia-tegra-tools-common  # version 5.15.0-1012.12
Since I’m not looking for anything vendor specific, I try to install the linux-tools-common package.
saint@machine:~$ sudo apt install linux-tools-common
Reading package lists... Done
Building dependency tree... Done
Reading state information... Done
The following NEW packages will be installed:
  linux-tools-common
0 upgraded, 1 newly installed, 0 to remove and 0 not upgraded.
Need to get 290 kB of archives.
After this operation, 823 kB of additional disk space will be used.
Ign:1 http://archive.ubuntu.com/ubuntu jammy-updates/main amd64 linux-tools-common all 5.15.0-71.78
Err:1 http://security.ubuntu.com/ubuntu jammy-updates/main amd64 linux-tools-common all 5.15.0-71.78
  404  Not Found [IP: ... 80]
E: Failed to fetch http://security.ubuntu.com/ubuntu/pool/main/l/linux/linux-tools-common_5.15.0-71.78_all.deb  404  Not Found [IP: ... 80]
E: Unable to fetch some archives, maybe run apt-get update or try with --fix-missing?
saint@machine:~$ sudo apt install linux-tools-common
Reading package lists... Done
Building dependency tree... Done
Reading state information... Done
The following NEW packages will be installed:
  linux-tools-common
0 upgraded, 1 newly installed, 0 to remove and 41 not upgraded.
Need to get 277 kB of archives.
After this operation, 833 kB of additional disk space will be used.
Get:1 http://archive.ubuntu.com/ubuntu jammy-updates/main amd64 linux-tools-common all 5.15.0-73.80 [277 kB]
Fetched 277 kB in 0s (793 kB/s)
Selecting previously unselected package linux-tools-common.
(Reading database ... 24137 files and directories currently installed.)
Preparing to unpack .../linux-tools-common_5.15.0-73.80_all.deb ...
Unpacking linux-tools-common (5.15.0-73.80) ...
Setting up linux-tools-common (5.15.0-73.80) ...
Processing triggers for man-db (2.10.2-1) ...
Can we run a perf command now? No, perf not found for my kernel.
saint@machine:~$ perf --version
WARNING: perf not found for kernel 5.10.102.1-microsoft

  You may need to install the following packages for this specific kernel:
    linux-tools-5.10.102.1-microsoft-standard-WSL2
    linux-cloud-tools-5.10.102.1-microsoft-standard-WSL2

  You may also want to install one of the following packages to keep up to date:
    linux-tools-standard-WSL2
    linux-cloud-tools-standard-WSL2
Is that really my kernel version? Yes it is.
saint@mymachine:~$ uname -a
Linux mymachine 5.10.102.1-microsoft-standard-WSL2 #1 SMP Wed Mar 2 00:30:59 UTC 2022 x86_64 x86_64 x86_64 GNU/Linux
Unfortunately, the suggested packages cannot be found:
saint@machine:~$ sudo apt install linux-tools-standard-WSL2
Reading package lists... Done
Building dependency tree... Done
Reading state information... Done
E: Unable to locate package linux-tools-standard-WSL2
saint@machine:~$ sudo apt install linux-tools-5.10.102.1-microsoft-standard-WSL2
Reading package lists... Done
Building dependency tree... Done
Reading state information... Done
E: Unable to locate package linux-tools-5.10.102.1-microsoft-standard-WSL2
E: Couldn't find any package by glob 'linux-tools-5.10.102.1-microsoft-standard-WSL2'
nt@machine:~$ sudo apt-get install linux-tools-5.10.102.1-microsoft-standard-WSL2
Reading package lists... Done
Building dependency tree... Done
Reading state information... Done
E: Unable to locate package linux-tools-5.10.102.1-microsoft-standard-WSL2
E: Couldn't find any package by glob 'linux-tools-5.10.102.1-microsoft-standard-WSL2'
E: Couldn't find any package by regex 'linux-tools-5.10.102.1-microsoft-standard-WSL2'
The interesting thing about this is that the version numbers shown in the list of packages to be installed do not match my kernel version. However, the installation succeeds.
saint@machine:~$ sudo apt install linux-tools-generic
Reading package lists... Done
Building dependency tree... Done
Reading state information... Done
The following additional packages will be installed:
  linux-tools-5.15.0-73 linux-tools-5.15.0-73-generic
The following NEW packages will be installed:
  linux-tools-5.15.0-73 linux-tools-5.15.0-73-generic linux-tools-generic
0 upgraded, 3 newly installed, 0 to remove and 41 not upgraded.
Need to get 7931 kB of archives.
After this operation, 27.3 MB of additional disk space will be used.
Do you want to continue? [Y/n] y
Get:1 http://archive.ubuntu.com/ubuntu jammy-updates/main amd64 linux-tools-5.15.0-73 amd64 5.15.0-73.80 [7926 kB]
Get:2 http://archive.ubuntu.com/ubuntu jammy-updates/main amd64 linux-tools-5.15.0-73-generic amd64 5.15.0-73.80 [1786 B]
Get:3 http://archive.ubuntu.com/ubuntu jammy-updates/main amd64 linux-tools-generic amd64 5.15.0.73.71 [2308 B]
Fetched 7931 kB in 2s (5163 kB/s)
Selecting previously unselected package linux-tools-5.15.0-73.
(Reading database ... 24210 files and directories currently installed.)
Preparing to unpack .../linux-tools-5.15.0-73_5.15.0-73.80_amd64.deb ...
Unpacking linux-tools-5.15.0-73 (5.15.0-73.80) ...
Selecting previously unselected package linux-tools-5.15.0-73-generic.
Preparing to unpack .../linux-tools-5.15.0-73-generic_5.15.0-73.80_amd64.deb ...
Unpacking linux-tools-5.15.0-73-generic (5.15.0-73.80) ...
Selecting previously unselected package linux-tools-generic.
Preparing to unpack .../linux-tools-generic_5.15.0.73.71_amd64.deb ...
Unpacking linux-tools-generic (5.15.0.73.71) ...
Setting up linux-tools-5.15.0-73 (5.15.0-73.80) ...
Setting up linux-tools-5.15.0-73-generic (5.15.0-73.80) ...
Setting up linux-tools-generic (5.15.0.73.71) ...
perf --version still fails though. It’s not a symlink to anything else.
saint@machine:~$ ls -l `which perf`
-rwxr-xr-x 1 root root 1622 May 15 07:10 /usr/bin/perf
However, there is a user that was able to use perf by running the tool in the /usr/lib/linux-tools/… directory. Sure enough, this does the trick!
saint@machine:~$ /usr/lib/linux-tools/5.15.0-73-generic/perf --version
perf version 5.15.98
Sharing Files Between Windows and WSL Ubuntu
I was curious about whether I could generate a report from a perf.data file generated on another machine. The docs on Working across file systems show how easy it is to use a file on the Windows file system:
cd /mnt/c/dev/reports
/usr/lib/linux-tools/5.15.0-73-generic/perf report -n --stdio > report.txt
This doesn’t work though. The command fails after about 40 seconds with the error No kallsyms or vmlinux with build-id 5c3d8... was found.
In the post on Experimenting with Async Profiler, I mentioned the basic (trial division) integer factorization app I wrote. I’ve been experimenting with perf to see what the system looks like when running this application. On Ubuntu, I started with this command:
perf record -F 97 -a -g -- sleep 10
Turns out perf isn’t installed by default.
WARNING: perf not found for kernel 5.19.0-41

  You may need to install the following packages for this specific kernel:
    linux-tools-5.19.0-41-generic
    linux-cloud-tools-5.19.0-41-generic

  You may also want to install one of the following packages to keep up to date:
    linux-tools-generic
    linux-cloud-tools-generic
Interestingly, running sudo apt install linux-tools-generic only picks up 5.17:
...
The following NEW packages will be installed:
  linux-tools-5.15.0-72 linux-tools-5.15.0-72-generic linux-tools-generic
...
which perf now shows /usr/bin/perf but even perf -v fails with the above warning so I have to run
sudo apt install linux-tools-5.19.0-41-generic

...
The following NEW packages will be installed:
  linux-hwe-5.19-tools-5.19.0-41 linux-tools-5.19.0-41-generic
...
Once that completes, perf can now run but perf version doesn’t display anything meaningful. Back to the original command:
perf record -F 97 -a -g -- sleep 10
This fails with an error about restricted access. Interesting reading but I just use sudo and carry on.
Error:
Access to performance monitoring and observability operations is limited.
Consider adjusting /proc/sys/kernel/perf_event_paranoid setting to open
access to performance monitoring and observability operations for processes
without CAP_PERFMON, CAP_SYS_PTRACE or CAP_SYS_ADMIN Linux capability.
More information can be found at 'Perf events and tool security' document:
https://www.kernel.org/doc/html/latest/admin-guide/perf-security.html
perf_event_paranoid setting is 4:
  -1: Allow use of (almost) all events by all users
      Ignore mlock limit after perf_event_mlock_kb without CAP_IPC_LOCK
>= 0: Disallow raw and ftrace function tracepoint access
>= 1: Disallow CPU event access
>= 2: Disallow kernel profiling
To make the adjusted perf_event_paranoid setting permanent preserve it
in /etc/sysctl.conf (e.g. kernel.perf_event_paranoid = <setting>)
Once the command completes, a perf.data file is created in the current directory. To generate a report, run this command. See the sample perf-report.txt file on GitHub.
perf report -n --stdio > perf-report.txt
To generate a flame graph, use Brendan Gregg’s scripts:
cd ~/repos
git clone https://github.com/brendangregg/FlameGraph

cd -

perf script --header > stacks.txt

~/repos/FlameGraph/stackcollapse-perf.pl < stacks.txt | ~/repos/FlameGraph/flamegraph.pl --hash > myflamegraph.svg
I have been studying the performance of a simple Java application (for integer factorization) using async-profiler. The application’s source code is on GitHub.
async-profiler is a low overhead sampling profiler for Java that does not suffer from Safepoint bias problem.
Once the application is running, use the profiler.sh script to attach to the Java process and start profiling it. I was interested in wall clock profiling. This is specified using the -e wall argument (see Part 2: Improving Performance with Async-profiler by Andrei Pangin. – YouTube). The command line below will profile the Java application with a 5ms sampling interval for a duration (-d) of 10 seconds.
# macos:
cd ~/java/binaries/async-profiler-2.9-macos

# Linux:
cd ~/java/binaries/async-profiler-2.9-linux

./profiler.sh -e wall -t -i 5ms -d 10 -f result.html jps
The jps argument above lets the profiler.sh script determine which Java process is running by calling The jps Command (oracle.com). If there are multiple Java processes, then run jps first to determine the process id of the one to be profiled then explicitly pass that pid to profiler.sh e.g.
To find out file types on macos, run file -I rawdata. In my case, I had flamegraph data that was shared as application/gzip (causing unzip to fail with End-of-central-directory signature not found. I needed to use gzip -d rawdata.