Alias name: dummy
Entry type: PrivateKeyEntry
Valid from: Mon May 16 04:06:38 MDT 2016 until: Sat May 16 04:06:38 MDT 2026
Signature algorithm name: SHA256withRSA
Subject Public Key Algorithm: 2048-bit RSA key
Alias name: dummydsa
Entry type: PrivateKeyEntry
Valid from: Thu Mar 29 17:06:34 MDT 2018 until: Tue Mar 28 17:06:34 MDT 2028
Signature algorithm name: SHA256withDSA
Subject Public Key Algorithm: 1024-bit DSA key (weak)
Alias name: dummyecdsa
Entry type: PrivateKeyEntry
Valid from: Mon May 16 04:09:01 MDT 2016 until: Sat May 16 04:09:01 MDT 2026
Signature algorithm name: SHA256withECDSA
Subject Public Key Algorithm: 256-bit EC (secp256k1) key (disabled)
Alias name: dummyecrsa
Entry type: PrivateKeyEntry
Valid from: Fri Apr 13 02:20:55 MDT 2018 until: Wed Apr 12 02:20:55 MDT 2028
Signature algorithm name: SHA256withRSA
Subject Public Key Algorithm: 256-bit EC (secp256r1) key
Valid from: Mon May 16 04:06:38 MDT 2016 until: Sat May 16 04:06:38 MDT 2026
Signature algorithm name: SHA256withRSA
Subject Public Key Algorithm: 2048-bit RSA key
Alias name: ecdsasecp256r1
Entry type: PrivateKeyEntry
Valid from: Tue Mar 27 16:41:31 MDT 2018 until: Sun Mar 26 16:41:31 MDT 2028
Signature algorithm name: SHA256withECDSA
Subject Public Key Algorithm: 256-bit EC (secp256r1) key

Warning:
<dummydsa> uses a 1024-bit DSA key which is considered a security risk. This key size will be disabled in a future update.
<dummyecdsa> uses a 256-bit EC (secp256k1) key which is considered a security risk and is disabled.
The JKS keystore uses a proprietary format. It is recommended to migrate to PKCS12 which is an industry standard format using "keytool -importkeystore -srckeystore C:/java/.../test/jdk/javax/net/ssl/etc/keystore -destkeystore C:/java/.../test/jdk/javax/net/ssl/etc/keystore -deststoretype pkcs12".
Aborting due to java.lang.OutOfMemoryError: Metaspace
#
# A fatal error has been detected by the Java Runtime Environment:
#
#  Internal Error (debug.cpp:289), pid=1234, tid=5678
#  fatal error: OutOfMemory encountered: Metaspace
#
# JRE version: OpenJDK Runtime Environment Microsoft-13945457 (25.0.3+9) (build 25.0.3+9-LTS)
# Java VM: OpenJDK 64-Bit Server VM Microsoft-13945457 (25.0.3+9-LTS, mixed mode, sharing, tiered, compressed oops, compressed class ptrs, g1 gc, windows-aarch64)
# Core dump will be written. Default location: D:\
The test failure output was:
getCoreFileLocation found stringWithLocation = D:\...\hs_err_pid1234.mdmp
Found core file D:\...\hs_err_pid1234.mdmp, size = 0mb
STDERR:
java.lang.RuntimeException: Test ERROR java.lang.RuntimeException: Unexpected core size: expected 0 > 0
	at ClhsdbFindPC.testFindPC(ClhsdbFindPC.java:317)
	at ClhsdbFindPC.main(ClhsdbFindPC.java:339)
	at java.base/jdk.internal.reflect.DirectMethodHandleAccessor.invoke(DirectMethodHandleAccessor.java:104)
	at java.base/java.lang.reflect.Method.invoke(Method.java:565)
	at com.sun.javatest.regtest.agent.MainWrapper$MainTask.run(MainWrapper.java:138)
	at java.base/java.lang.Thread.run(Thread.java:1474)
Caused by: java.lang.RuntimeException: Unexpected core size: expected 0 > 0
	at jdk.test.lib.Asserts.fail(Asserts.java:715)
	at jdk.test.lib.Asserts.assertGreaterThan(Asserts.java:403)
	at jdk.test.lib.Asserts.assertGT(Asserts.java:374)
	at jdk.test.lib.util.CoreUtils.getCoreFileLocation(CoreUtils.java:113)
	at ClhsdbFindPC.testFindPC(ClhsdbFindPC.java:113)
	... 5 more
The issue here clearly appears to be that the JVM ran out of memory before it could complete the test. However, I wanted to save the expected output from the test for quick reference in future:
# A fatal error has been detected by the Java Runtime Environment:
#
#  EXCEPTION_ACCESS_VIOLATION (0xc0000005) at pc=0x00007ffaf8cd112c, pid=1234, tid=5678
#
# JRE version: OpenJDK Runtime Environment Microsoft-13945457 (25.0.3+9) (build 25.0.3+9-LTS)
# Java VM: OpenJDK 64-Bit Server VM Microsoft-13945457 (25.0.3+9-LTS, compiled mode, sharing, tiered, compressed oops, compressed class ptrs, g1 gc, windows-aarch64)
# Problematic frame:
# C  [LingeredApp.dll+0x112c]
#
# Core dump will be written. Default location: C:\...
If the test is working correctly, the crash should come from LingeredApp.dll. This binary is in the test image, specifically in hotspot/jtreg/native. LingeredApp.java has a native method called crash(). It’s implementation in libLingeredApp.c dereferences a non-null invalid pointer with set bits in every word. This guarantees that an EXCEPTION_ACCESS_VIOLATION should be seen if the test ran correctly.
Verifying Signed JAR Files states that the basic command to use for verifying a signed JAR file is jarsigner -verify jar-file. The jarsigner Command adds that when the -strict option is specified, it constructs the exit code depending on which checks failed. We can check the exit code using echo $? in bash. For example, I get exit code 16 for my unsigned JAR file with --strict but exit code 0 without it.
cd /c/repos/factorize/java/project
time mvn package

export JAVA_HOME=/d/java/binaries/jdk/x64/2026-04/windows-jdk25u/jdk-25.0.3+9

$JAVA_HOME/bin/jarsigner -verify -strict target/factorize-1.0.0-jar-with-dependencies.jar

echo $?
Warning:  Different store and key passwords not supported for PKCS12 KeyStores. Ignoring user-specified -keypass value.
keytool error: java.lang.Exception: The -keyalg option must be specified.
Generating 2048-bit DSA key pair and self-signed certificate (SHA256withDSA) with a validity of 180 days
        for: CN=Saint Wesonga, OU=Java, O=Microsoft, C=US
$JAVA_HOME/bin/jarsigner \
 -keystore mykeys/mykeystore \
 -signedjar target/factorize-1.0.0-signed-jar-with-dependencies.jar \
 target/factorize-1.0.0-jar-with-dependencies.jar business
Its output is:
Enter Passphrase for keystore:

jar signed.

Warning:
The signer's certificate is self-signed.
POSIX file permission and/or symlink attributes detected. These attributes are ignored when signing and are not protected by the signature.
Earlier this year I dug into intermittent test hangs in the ProducerConsumerLoops test when using the Windows AArch64 JDK 25 build. I decided to test it on JDK 17 and JDK 21 to see how far back the hang went:
export JAVA_HOME17=/c/java/binaries/jdk/aarch64/2025-10/windows-jdk17u/jdk-17.0.17+10
export JAVA_HOME21=/c/java/binaries/jdk/aarch64/2025-10/windows-jdk21u/jdk-21.0.9+10

date; time $JAVA_HOME17/bin/java -Xcomp -XX:-TieredCompilation ProducerConsumerLoops
date; time $JAVA_HOME21/bin/java -Xcomp -XX:-TieredCompilation ProducerConsumerLoops
The test passed on jdk17u but hang on jdk21u. The hang did not happen with -Xint or -Xcomp -XX:TieredStopAtLevel=1 and the jstack command did not report any deadlock. I couldn’t find a Windows AArch64 jdk19u build to test, so I had to build the sources myself. I suspected that I would need a jdk18u build for the jdk19u boot JDK, so I started by building jdk18u. See Building OpenJDK 18 for Windows AArch64 for details on the errors I ran into and how I worked around them – I needed a jdk18u build for the boot JDK when building jdk18u.
configure: Found potential Boot JDK using configure arguments
configure: Potential Boot JDK found at /cygdrive/d/java/binaries/jdk/x64/2025-10/windows-jdk17u/jdk-17.0.17+10 is incorrect JDK version (openjdk version "17.); ignoring-Bit Server VM Microsoft-12574423 (build 17.0.17+10-LTS, mixed mode, sharing)
configure: (Your Boot JDK version must be one of: 18 19)
configure: error: The path given by --with-boot-jdk does not contain a valid Boot JDK
configure exiting with result code 1
ERROR: Build failed for target 'images' in configuration 'windows-aarch64-server-release' (exit code 2)
Stopping javac server

=== Output from failing command(s) repeated here ===
* For target support_native_jdk.jdwp.agent_libjdwp_debugInit.obj:
debugInit.c
d:\java\forks\openjdk\jdk\src\jdk.jdwp.agent\share\native\libjdwp\debugInit.c(248): error C2220: the following warning is treated as an error
d:\java\forks\openjdk\jdk\src\jdk.jdwp.agent\share\native\libjdwp\debugInit.c(248): warning C5287: operands are different enum types '<unnamed-enum-JVMTI_VERSION_1>' and '<unnamed-enum-JVMTI_VERSION_MASK_INTERFACE_TYPE>'; use an explicit cast to silence this warning
d:\java\forks\openjdk\jdk\src\jdk.jdwp.agent\share\native\libjdwp\debugInit.c(248): note: to simplify migration, consider the temporary use of /Wv:18 flag with the version of the compiler with which you used to build without warnings
d:\java\forks\openjdk\jdk\src\jdk.jdwp.agent\share\native\libjdwp\debugInit.c(250): warning C5287: operands are different enum types '<unnamed-enum-JVMTI_VERSION_1>' and '<unnamed-enum-JVMTI_VERSION_MASK_INTERFACE_TYPE>'; use an explicit cast to silence this warning
d:\java\forks\openjdk\jdk\src\jdk.jdwp.agent\share\native\libjdwp\debugInit.c(250): note: to simplify migration, consider the temporary use of /Wv:18 flag with the version of the compiler with which you used to build without warnings
d:\java\forks\openjdk\jdk\src\jdk.jdwp.agent\share\native\libjdwp\debugInit.c(252): warning C5287: operands are different enum types '<unnamed-enum-JVMTI_VERSION_1>' and '<unnamed-enum-JVMTI_VERSION_MASK_INTERFACE_TYPE>'; use an explicit cast to silence this warning
d:\java\forks\openjdk\jdk\src\jdk.jdwp.agent\share\native\libjdwp\debugInit.c(252): note: to simplify migration, consider the temporary use of /Wv:18 flag with the version of the compiler with which you used to build without warnings
   ... (rest of output omitted)

* All command lines available in /cygdrive/d/java/forks/openjdk/jdk/build/windows-aarch64-server-release/make-support/failure-logs.
=== End of repeated output ===
I deleted the build directory and reran configure with the --disable-warnings-as-errors flag to work around this and found that the test passed on the jdk20u (release configuration) build.
checking for gtest... /cygdrive/d/repos/googletest
configure: error: gtest version is too old, at least version 1.13.0 is required
configure exiting with result code 1
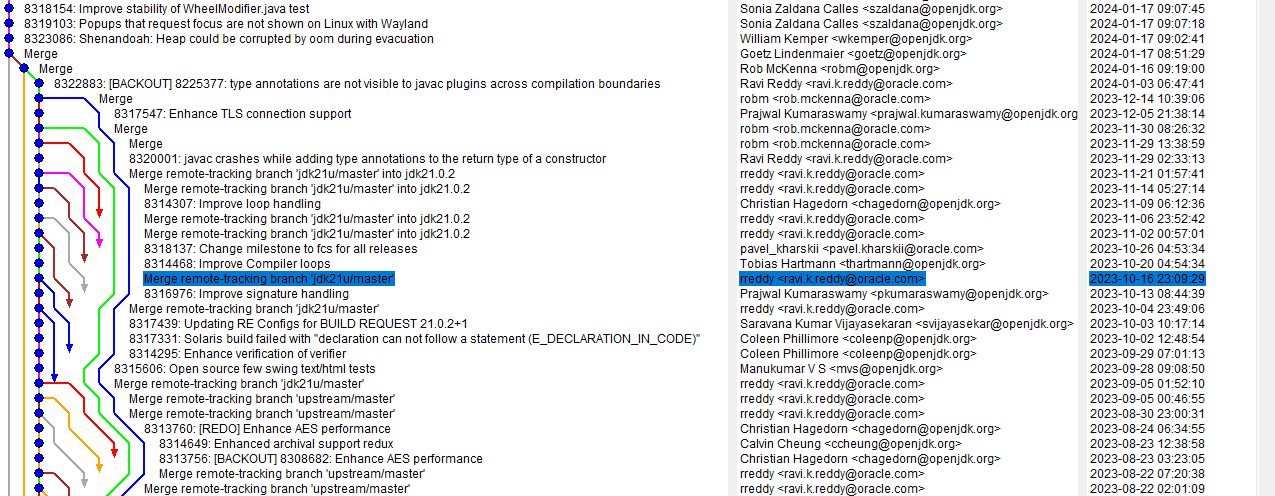
I fixed the gtest tag and the test passed on that Windows AArch64 build. It looked like the test was passing on every build was so I decided to build the end tag of the search: jdk-21+26. The test passed there too! I downloaded the 21.0.9+10 build from Adoptium and it failed so I needed to continue bisecting in the jdk21u repo. I had a fork of openjdk/jdk21u-dev locally so I started by searching (by JBS ID) for the last commit that passed the test on tip:
$ git log --grep='8306841'
commit bb377b26730f3d9da7c76e0d171517e811cef3ce (tag: jdk-22+0, tag: jdk-21+26)
Author: Stefan Karlsson <stefank@openjdk.org>
Date:   Thu Jun 8 14:06:27 2023 +0000

    8306841: Generational ZGC: NMT reports Java heap size larger than max heap size

    Reviewed-by: eosterlund, stuefe
# show log up to a specific commit
git log bb377b2..HEAD

# show just summary line of a commit
git show -s --oneline bb377b2..HEAD

# command to count number of lines (outputs 1727)
git show -s --oneline bb377b2..HEAD | wc -l

# show the commit halfway between the two ends
git show -s --oneline bb377b2..HEAD | head -n 863

# outputs 8ac431347fd 8324723: GHA: Upgrade some actions to avoid deprecated Node 16

git checkout 8ac431347fd
# command to count number of lines (outputs 865)
git show -s --oneline bb377b2..8ac4313 | wc -l

# show the commit halfway between the two ends
git show -s --oneline bb377b2..8ac4313 | head -n 432

# outputs a4e78f30fce Merge remote-tracking branch 'jdk21u/master'
$ git checkout 9ca8761
error: short object ID 9ca8761 is ambiguous
hint: The candidates are:
hint:   9ca87615550 commit 2024-01-17 - 8323086: Shenandoah: Heap could be corrupted by oom during evacuation
hint:   9ca8761a221 tree
error: pathspec '9ca8761' did not match any file(s) known to git

$ git checkout 9ca87615550eba5493dde94e6204e58ca8cc1119
Below are some example commands showing how to which assembly instruction to use in the SpinWait() call and how many of them should be used. On my Surface Pro X, the SB instruction is not supported. A good post to read about various barrier instructions is The AArch64 processor (aka arm64), part 14: Barriers – The Old New Thing.
$ $JDKTOTEST/bin/java -Xcomp -XX:-TieredCompilation -XX:+UnlockDiagnosticVMOptions -XX:OnSpinWaitInst=sb ProducerConsumerLoops
Error occurred during initialization of VM
OnSpinWaitInst is SB but current CPU does not support SB instruction

$ $JDKTOTEST/bin/java -Xcomp -XX:-TieredCompilation -XX:+UnlockDiagnosticVMOptions -XX:OnSpinWaitInst=nop -XX:OnSpinWaitInstCount=5 ProducerConsumerLoops
The snippet below shows the 4 instructions in the spin_wait stub if the isb instruction is selected with a count of 3 (after copying the Linux SpinPause implementation). Whether or not this is a good idea is not the point, this is about showing what the flags do.
000001800B9D0700  isb         sy
000001800B9D0704  isb         sy
000001800B9D0708  isb         sy
000001800B9D070C  ret

extern "C" {
  int SpinPause() {
00007FFAB97A5CF8  stp         fp,lr,[sp,#-0x20]!
00007FFAB97A5CFC  mov         fp,sp
    using spin_wait_func_ptr_t = void (*)();
    spin_wait_func_ptr_t func = CAST_TO_FN_PTR(spin_wait_func_ptr_t, StubRoutines::aarch64::spin_wait());
00007FFAB97A5D00  bl          StubRoutines::aarch64::spin_wait (07FFAB97A63B8h)+#0xFFFF8005DA859DF6
00007FFAB97A5D04  mov         x8,x0
00007FFAB97A5D08  str         x8,[sp,#0x10]
    assert(func != nullptr, "StubRoutines::aarch64::spin_wait must not be null.");
00007FFAB97A5D0C  mov         w8,#0
00007FFAB97A5D10  cmp         w8,#0
00007FFAB97A5D14  bne         SpinPause+34h (07FFAB97A5D2Ch)
00007FFAB97A5D18  bl          DebuggingContext::is_enabled (07FFAB8619D18h)+#0xFFFF8005DF5832E8
00007FFAB97A5D1C  uxtb        w8,w0
00007FFAB97A5D20  mov         w8,w8
00007FFAB97A5D24  cmp         w8,#0
00007FFAB97A5D28  bne         SpinPause+74h (07FFAB97A5D6Ch)
00007FFAB97A5D2C  ldr         x8,[sp,#0x10]
00007FFAB97A5D30  cmp         x8,#0
00007FFAB97A5D34  bne         SpinPause+74h (07FFAB97A5D6Ch)
00007FFAB97A5D38  adrp        x8,g_assert_poison (07FFABAA80F88h)+#0xFFFF800635588740
00007FFAB97A5D3C  ldr         x9,[x8,g_assert_poison (07FFABAA80F88h)+#0xFFFF80063E9FB581]
00007FFAB97A5D40  mov         w8,#0x58
00007FFAB97A5D44  strb        w8,[x9]
00007FFAB97A5D48  adrp        x8,siglabels+690h (07FFABA5C5000h)
00007FFAB97A5D4C  add         x3,x8,#0x450
00007FFAB97A5D50  adrp        x8,siglabels+690h (07FFABA5C5000h)
00007FFAB97A5D54  add         x2,x8,#0x488
00007FFAB97A5D58  mov         w1,#0x128
00007FFAB97A5D5C  adrp        x8,siglabels+690h (07FFABA5C5000h)
00007FFAB97A5D60  add         x0,x8,#0x4B0
00007FFAB97A5D64  bl          report_vm_error (07FFAB8D15210h)+#0xFFFF8005DF046B1B
00007FFAB97A5D68  nop
00007FFAB97A5D6C  mov         w8,#0
00007FFAB97A5D70  cmp         w8,#0
00007FFAB97A5D74  bne         SpinPause+14h (07FFAB97A5D0Ch)
    (*func)();
00007FFAB97A5D78  ldr         x8,[sp,#0x10]
00007FFAB97A5D7C  blr         x8
    // If StubRoutines::aarch64::spin_wait consists of only a RET,
    // SpinPause can be considered implemented. There will be a sequence
    // of instructions for:
    // - call of SpinPause
    // - load of StubRoutines::aarch64::spin_wait stub pointer
    // - indirect call of the stub
    // - return from the stub
    // - return from SpinPause
    // So '1' always is returned.
    return 1;
00007FFAB97A5D80  mov         w0,#1
00007FFAB97A5D84  ldp         fp,lr,[sp],#0x20
00007FFAB97A5D88  ret
00007FFAB97A5D8C  ?? ??????
}
SpinPause is also used by the G1 collector as shown in the callstack below:
I am investigating a (Windows AArch64) test that passes on jdk17u but fails on jdk21u. I need to bisect to the first commit with a release build that fails this test. Unfortunately, Latest Releases | Adoptium doesn’t have Windows AArch64 builds between jdk17u and jdk21u so I had to build them myself. To find the commits for the intermediate releases, I used this command:
This let me identify the tag I needed on GitHub: openjdk/jdk at jdk-18-ga. I set up the jdk18u build option in my personal build script: Add config options for more jdk versions · swesonga/scratchpad@98ab982 and set up google/googletest at v1.14.0. Unfortunately, I got compilation errors stating that ‘FLAGS_gtest_internal_run_death_test’: is not a member of ‘testing::internal’. There were also errors about an identifier that could not be found in winnt.h. Here’s how I addressed them.
Identifier not found in winnt.h
There were errors in “C:\Program Files (x86)\Windows Kits\10\Include\10.0.26100.0\um\winnt.h” stating that the _CountOneBits64 identifier could not be found:
ERROR: Build failed for target 'images' in configuration 'windows-aarch64-server-release' (exit code 2)
Stopping sjavac server

=== Output from failing command(s) repeated here ===
* For target hotspot_variant-server_libjvm_gtest_launcher-objs_gtestLauncher.obj:
gtestLauncher.cpp
c:\progra~2\wi3cf2~1\10\include\100261~1.0\um\winnt.h(6343): error C3861: '_CountOneBits64': identifier not found
   ... (rest of output omitted)
* For target hotspot_variant-server_libjvm_gtest_objs_BUILD_GTEST_LIBJVM_pch.obj:
BUILD_GTEST_LIBJVM_pch.cpp
c:\progra~2\wi3cf2~1\10\include\100261~1.0\um\winnt.h(6343): error C3861: '_CountOneBits64': identifier not found
   ... (rest of output omitted)
* For target hotspot_variant-server_libjvm_libgtest_objs_gtest-all.obj:
gtest-all.cc
c:\progra~2\wi3cf2~1\10\include\100261~1.0\um\winnt.h(6343): error C3861: '_CountOneBits64': identifier not found
   ... (rest of output omitted)
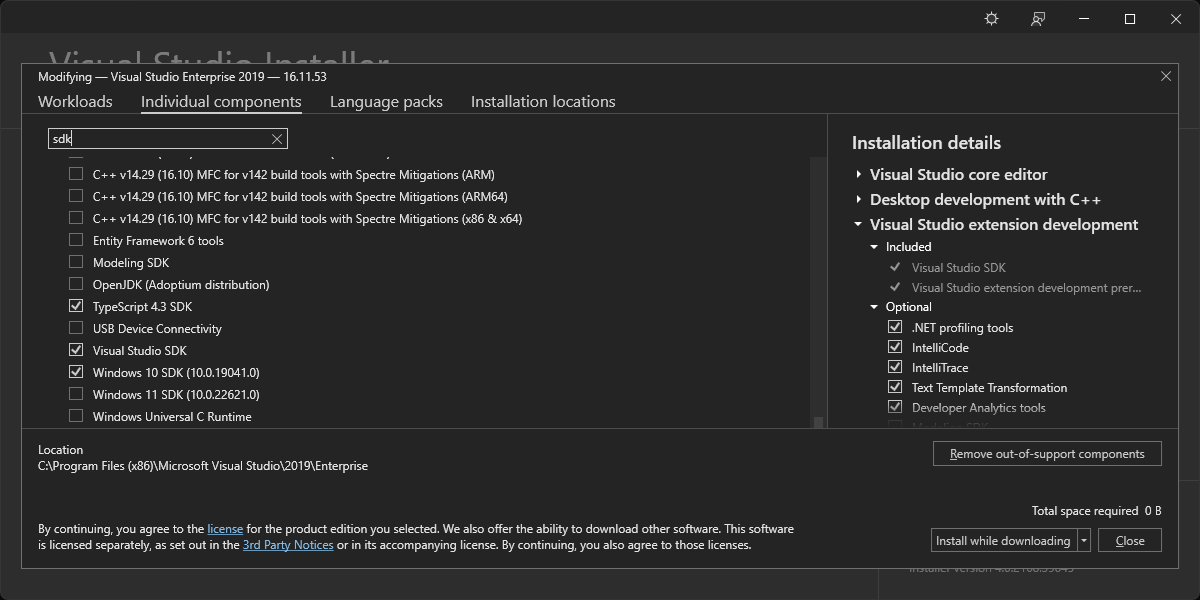
The Visual Studio 2019 installer showed only the Windows 10 SDK installed:
I set off on a journey of discovery, seeking to learn how the SDK is selected for the build.
VS_ENV_CMD is set in the TOOLCHAIN_CHECK_POSSIBLE_VISUAL_STUDIO_ROOT macro in toolchain_microsoft.m4 to the 64-bit path in the TOOLCHAIN_CHECK_POSSIBLE_VISUAL_STUDIO_ROOT macro. This path on my machine is “C:\Program Files\Microsoft Visual Studio\2022\Enterprise\VC\Auxiliary\Build\vcvarsamd64_arm64.bat“. It contains this line: @call "%~dp0vcvarsall.bat" x64_arm64 %*. This command calls the vcvarsall.bat file in the same directory. “build\windows-aarch64-server-release\configure-support\config.log” doesn’t seem to have any SDK-related output. vcvarsall.bat in turn calls “C:\Program Files\Microsoft Visual Studio\2022\Enterprise\Common7\Tools\VsDevCmd.bat“. I don’t think it passes the -winsdk argument. VsDevCmd.bat then calls “C:\Program Files\Microsoft Visual Studio\2022\Enterprise\Common7\Tools\vsdevcmd\core\winsdk.bat“, which has a GetWin10SdkDir function that is called if the VSCMD_ARG_WINSDK environment variable has not been set. GetWin10SdkDirHelper queries these locations:
HKLM\SOFTWARE\Wow6432Node
HKCU\SOFTWARE\Wow6432Node
HKLM\SOFTWARE
HKCU\SOFTWARE
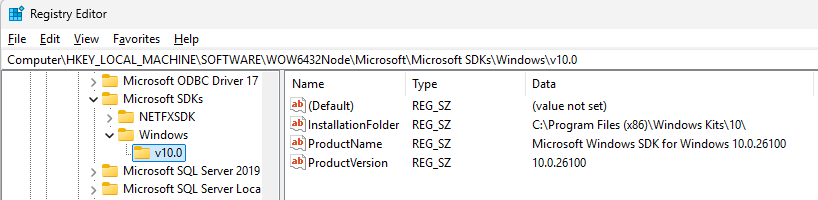
More specifically, it searches in the Microsoft\Microsoft SDKs\Windows\v10.0 subkey of each of them for the InstallationFolder value. The WindowsSdkDir environment variable is set to the value found here. It would be set to “C:\Program Files (x86)\Windows Kits\10\” on my machine (shown below).
I tried setting the environment variable before configuring the build but that didn’t work:
  AC_MSG_NOTICE([Trying to extract Visual Studio environment variables for $TARGET_CPU])
  AC_MSG_NOTICE([using $VS_ENV_CMD $VS_ENV_ARGS])
configure: Using default toolchain microsoft (Microsoft Visual Studio)
configure: Found Visual Studio installation at /cygdrive/c/progra~2/micros~3/2019/Enterprise using well-known name
configure: Found Microsoft Visual Studio 2019
configure: Trying to extract Visual Studio environment variables for aarch64
configure: using /cygdrive/c/progra~2/micros~3/2019/Enterprise/vc/auxiliary/build/vcvarsamd64_arm64.bat
configure: Setting extracted environment variables for aarch64
This shows that no arguments are passed to vcvarsamd64_arm64.bat (and therefore to vcvarsall.bat as well). Since vcvarsall.bat has logic that parses 10.* strings into the __VCVARSALL_WINSDK variable (to pass on to VsDevCmd.bat), I realized that I could just specify the SDK version when calling vcvarsamd64_arm64.bat. I used this diff (on commit 0f2113cee79):
diff --git a/make/autoconf/toolchain_microsoft.m4 b/make/autoconf/toolchain_microsoft.m4
index 2600b431cfb..a7d6aaae250 100644
--- a/make/autoconf/toolchain_microsoft.m4
+++ b/make/autoconf/toolchain_microsoft.m4
@@ -349,7 +349,7 @@ AC_DEFUN([TOOLCHAIN_EXTRACT_VISUAL_STUDIO_ENV],
   # We can't pass -vcvars_ver=$VCVARS_VER here because cmd.exe eats all '='
   # in bat file arguments. :-(
   $FIXPATH $CMD /c "$TOPDIR/make/scripts/extract-vs-env.cmd" "$VS_ENV_CMD" \
-      "$VS_ENV_TMP_DIR/set-vs-env.sh" $VCVARS_VER $VS_ENV_ARGS \
+      "$VS_ENV_TMP_DIR/set-vs-env.sh" $VCVARS_VER $VS_ENV_ARGS 10.0.22621.0 \
       > $VS_ENV_TMP_DIR/extract-vs-env.log | $CAT 2>&1
   PATH="$OLDPATH"
This enabled the build to use the SDK version I specified.
gtest undeclared identifier Error
The remaining build failures were related to gtests:
ERROR: Build failed for target 'images' in configuration 'windows-aarch64-server-release' (exit code 2)

=== Output from failing command(s) repeated here ===
* For target buildjdk_hotspot_variant-server_libjvm_gtest_objs_gtestMain.obj:
gtestMain.cpp
d:\java\forks\openjdk\jdk\test\hotspot\gtest\gtestMain.cpp(233): error C2039: 'FLAGS_gtest_internal_run_death_test': is not a member of 'testing::internal'
d:\repos\googletest\googlemock\include\gmock/gmock-nice-strict.h(80): note: see declaration of 'testing::internal'
d:\java\forks\openjdk\jdk\test\hotspot\gtest\gtestMain.cpp(233): error C2065: 'FLAGS_gtest_internal_run_death_test': undeclared identifier
   ... (rest of output omitted)
* For target hotspot_variant-server_libjvm_gtest_objs_gtestMain.obj:
gtestMain.cpp
d:\java\forks\openjdk\jdk\test\hotspot\gtest\gtestMain.cpp(233): error C2039: 'FLAGS_gtest_internal_run_death_test': is not a member of 'testing::internal'
d:\repos\googletest\googlemock\include\gmock/gmock-nice-strict.h(80): note: see declaration of 'testing::internal'
d:\java\forks\openjdk\jdk\test\hotspot\gtest\gtestMain.cpp(233): error C2065: 'FLAGS_gtest_internal_run_death_test': undeclared identifier
   ... (rest of output omitted)

* All command lines available in /cygdrive/d/java/forks/openjdk/jdk/build/windows-aarch64-server-release/make-support/failure-logs.
=== End of repeated output ===
Before my changes, safefetch.hpp included safefetch_windows.hpp, which uses structured exception handling. The read is done in a __try { } __except block. However, the Windows AArch64 port uses vectored exception handling. This is therefore not the right approach. I added the !defined(_M_ARM64) check to ensure that safefetch_static.hpp is included instead. This requires us to implement SafeFetch32_impl and SafeFetchN_impl, the same way the Linux and macosx AArch64 implementation do. These functions are declared as extern C because they will be implemented in assembly, specifically in safefetch_windows_aarch64.S. Here’s the implementation of SafeFetchN_impl (copied to match the other 2 AArch64 platforms):
    ; Support for intptr_t SafeFetchN(intptr_t* address, intptr_t defaultval);
    ;
    ;  x0 : address
    ;  x1 : defaultval

    ALIGN  4
    EXPORT _SafeFetchN_fault
    EXPORT _SafeFetchN_continuation
    EXPORT SafeFetchN_impl

SafeFetchN_impl
_SafeFetchN_fault
    ldr      x0, [x0]
    ret

_SafeFetchN_continuation
    mov      x0, x1
    ret

    END
Notice that it is a 4 assembly instructions function. The ldr instruction tries to dereference the pointer in x0. If the memory access succeeds, the function returns the loaded value successfully. Otherwise, the exception handler will be invoked. The exception handling logic checks whether the exception being handled was caused by the safefetch load. This is where the _SafeFetchN_fault label comes into play. If the exception is an EXCEPTION_ACCESS_VIOLATION, we can check whether the PC was at the _SafeFetchN_fault (the ldr) instruction. If so, the exception handler sets the PC in the OS CONTEXT structure to the _SafeFetchN_continuation instruction. The exception handler then returns EXCEPTION_CONTINUE_EXECUTION to allow execution to resume successfully at the mov instruction, which simply loads x0 with the error value that was passed in x1. The 32-bit safefetch function has an identical structure.
A few months ago, I was investigating some exception handling OpenJDK bugs on Windows AArch64. One of the bugs was in the safefetch implementation. I needed to switch part of the implementation to assembly language (similar to the Linux and macosx aarch64 safefetch implementations). Compilation failed after I added the new safefetch_windows_aarch64.S assembly source file. The failing command line was in the .cmdline file when the build terminated:
Command from build\windows-x86_64-server-slowdebug\make-support\failure-logs\support_native_jdk.incubator.vector_libjsvml_jsvml_d_acos_windows_x86.obj.cmdline

/cygdrive/d/java/ms/dups/openjdk-jdk/build/windows-x86_64-server-slowdebug/fixpath exec /cygdrive/c/progra~1/mib055~1/2022/enterprise/vc/tools/msvc/14.44.35207/bin/hostx64/x64/ml64.exe -nologo -c -Ta -Fo/cygdrive/d/java/ms/dups/openjdk-jdk/build/windows-x86_64-server-slowdebug/support/native/jdk.incubator.vector/libjsvml/jsvml_d_acos_windows_x86.obj /cygdrive/d/java/ms/dups/openjdk-jdk/src/jdk.incubator.vector/windows/native/libjsvml/jsvml_d_acos_windows_x86.S

From build\windows-x86_64-server-slowdebug\make-support\failure-logs\support_native_jdk.incubator.vector_libjsvml_jsvml_d_acos_windows_x86.obj.log

 Assembling: -Fod:\java\ms\dups\openjdk-jdk\build\windows-x86_64-server-slowdebug\support\native\jdk.incubator.vector\libjsvml\jsvml_d_acos_windows_x86.obj
MASM : fatal error A1000:cannot open file : -Fod:\java\ms\dups\openjdk-jdk\build\windows-x86_64-server-slowdebug\support\native\jdk.incubator.vector\libjsvml\jsvml_d_acos_windows_x86.obj
I just needed to have a separate else branch to handle setting up armasm64.exe to avoid passing ml64.exe flags to armasm64.exe. This successfully assembled my AArch64 assembly source file. However, the JVM would terminate with an access violation, which clearly isn’t supposed to happen because the fetch is supposed to be safe, by definition! I asked copilot: when would the program counter pointing at this aarch64 instruction result in an access violation? mov x0, x1. One scenario:
The Program Counter (PC) is pointing to an invalid address
If the PC is pointing to a location that is not mapped in the process’s address space (e.g., due to corruption, jumping to unmapped memory, or executing data as code), then fetching the instruction itself could trigger an access violation.
Example: If the PC points to a region of memory that has been freed or is protected (e.g., read-only or non-executable), the CPU will raise a fault when trying to fetch or decode the instruction.
This gave me a hint that my assembly instructions were probably not in an executable page! I found the AREA directive details at ARM Compiler armasm Reference Guide Version 6.01. It was tricky that the first AREA argument is a name and could therefore be anything. If I recall correctly, I think the access violation was because I didn’t have the CODE attribute on the AREA. With that fixed, I was able to successfully execute the compiled JVM.
This resulted in this error, which confirmed that it was a valid place to set the flag:
=== Output from failing command(s) repeated here ===
* For target support_native_jdk.incubator.vector_libjsvml_BUILD_LIBJSVML_run_ld:
LINK : fatal error LNK1181: cannot open input file 'd:\java\forks\dups12\openjdk\jdk\build\windows-x86_64-server-slowdebug\support\native\jdk.incubator.vector\libjsvml\jsvml_d_acos_windows_x86.obj'
* For target support_native_jdk.incubator.vector_libjsvml_jsvml_d_acos_windows_x86.obj:
 Assembling: sdf
MASM : fatal error A1000:cannot open file : sdf
* For target support_native_jdk.incubator.vector_libjsvml_jsvml_d_asin_windows_x86.obj:
 Assembling: sdf
MASM : fatal error A1000:cannot open file : sdf
After Magnus’s feedback on 8/23, I reverted that change and tried this instead:
diff --git a/make/autoconf/flags.m4 b/make/autoconf/flags.m4
index d50538108a4..8ba1a313cb2 100644
--- a/make/autoconf/flags.m4
+++ b/make/autoconf/flags.m4
@@ -320,6 +320,11 @@ AC_DEFUN([FLAGS_SETUP_TOOLCHAIN_CONTROL],
 [
   if test "x$TOOLCHAIN_TYPE" = xmicrosoft; then
     CC_OUT_OPTION=-Fo
+    if test "x$OPENJDK_TARGET_CPU" = xaarch64; then
+      AS_NON_ASM_EXTENSION_FLAG=
+    else
+      AS_NON_ASM_EXTENSION_FLAG=-Tazzz
+    endif
   else
     # The option used to specify the target .o,.a or .so file.
     # When compiling, how to specify the to be created object file.
diff --git a/make/common/native/CompileFile.gmk b/make/common/native/CompileFile.gmk
index 26472da6d02..7f8e8ffeddc 100644
--- a/make/common/native/CompileFile.gmk
+++ b/make/common/native/CompileFile.gmk
@@ -236,7 +236,7 @@ define CreateCompiledNativeFileBody
             # For assembler calls just create empty dependency lists
            $$(call ExecuteWithLog, $$@, $$(call MakeCommandRelative, \
                $$($1_COMPILER) $$($1_FLAGS) \
-               $(CC_OUT_OPTION)$$($1_OBJ) $$($1_SRC_FILE))) \
+               $(CC_OUT_OPTION)$$($1_OBJ) $(AS_NON_ASM_EXTENSION_FLAG) $$($1_SRC_FILE))) \
                | $(TR) -d '\r' | $(GREP) -v -e "Assembling:" || test "$$$$?" = "1" ; \
            $(ECHO) > $$($1_DEPS_FILE) ; \
            $(ECHO) > $$($1_DEPS_TARGETS_FILE)
The configure script failed:
Runnable configure script is not present
Generating runnable configure script at /cygdrive/d/java/forks/dups12/openjdk/jdk/build/.configure-support/generated-configure.sh
Using autoconf at /usr/bin/autoconf [autoconf (GNU Autoconf) 2.72]
-:166141: error: possibly undefined macro: AS_NON_ASM_EXTENSION_FLAG
      If this token and others are legitimate, please use m4_pattern_allow.
      See the Autoconf documentation.
configure: Configuration created at Sat Aug 23 15:11:36 MDT 2025.
On the prompt " recipe commences before first target" Copilot says:
The error message “recipe commences before first target” in GNU Make typically means that there’s a line in your Makefile that starts with a tab (indicating a recipe), but it appears before any target has been defined. In Makefiles, recipes (commands to execute) must follow a target and its dependencies.
I moved the check further up, which fixed the build. After the PR was closed, I got a comment about the quotes I introduced! They shouldn’t be there :(.
The test fails with the output below. The key line is Native frames: <unavailable>.
STDOUT:
Command line: [C:\java\forks\openjdk\jdk\build\windows-aarch64-server-slowdebug\images\jdk\bin\java.exe -cp C:\java\forks\openjdk\jdk\JTwork\classes\runtime\jni\nativeStack\TestNativeStack.d;C:\java\forks\openjdk\jdk\test\hotspot\jtreg\runtime\jni\nativeStack;C:\java\forks\openjdk\jdk\JTwork\classes\test\lib;C:\java\binaries\jtreg\jtreg-7.5.2\lib\javatest.jar;C:\java\binaries\jtreg\jtreg-7.5.2\lib\jtreg.jar;C:\java\binaries\jtreg\jtreg-7.5.2\lib\junit-platform-console-standalone-1.11.0.jar;C:\java\binaries\jtreg\jtreg-7.5.2\lib\testng-7.3.0.jar;C:\java\binaries\jtreg\jtreg-7.5.2\lib\guice-5.1.0.jar;C:\java\binaries\jtreg\jtreg-7.5.2\lib\jcommander-1.82.jar -Xmx512m -Xcheck:jni -Djava.library.path=C:\java\forks\openjdk\jdk\build\windows-aarch64-server-slowdebug\support\test\hotspot\jtreg\native\lib TestNativeStack$Main ]
[2025-09-04T15:54:18.312130500Z] Gathering output for process 22380
[2025-09-04T15:54:18.753851700Z] Waiting for completion for process 22380
[2025-09-04T15:54:18.756861300Z] Waiting for completion finished for process 22380
Output and diagnostic info for process 22380 was saved into 'pid-22380-output.log'
STDERR:
 stdout: [Triggering a JNI warning
WARNING in native method: JNI call made without checking exceptions when required to from CallStaticObjectMethod
Native frames: <unavailable>
];
 stderr: [WARNING: A restricted method in java.lang.System has been called
WARNING: java.lang.System::loadLibrary has been called by TestNativeStack in an unnamed module (file:/C:/java/forks/openjdk/jdk/JTwork/classes/runtime/jni/nativeStack/TestNativeStack.d/)
WARNING: Use --enable-native-access=ALL-UNNAMED to avoid a warning for callers in this module
WARNING: Restricted methods will be blocked in a future release unless native access is enabled

]
 exitValue = -2147483645

java.lang.RuntimeException: Expected to get exit value of [0], exit value is: [-2147483645]
        at jdk.test.lib.process.OutputAnalyzer.shouldHaveExitValue(OutputAnalyzer.java:522)
        at TestNativeStack.main(TestNativeStack.java:57)
        at java.base/jdk.internal.reflect.DirectMethodHandleAccessor.invoke(DirectMethodHandleAccessor.java:104)
        at java.base/java.lang.reflect.Method.invoke(Method.java:565)
        at com.sun.javatest.regtest.agent.MainActionHelper$AgentVMRunnable.run(MainActionHelper.java:335)
        at java.base/java.lang.Thread.run(Thread.java:1474)
I added a DebugBreak call to the line outputing that message to see how we got there:
KernelBase.dll!...DebugBreak() Line 2582	C++
jvm.dll!NativeStackPrinter::print_stack_from_frame(outputStream * st, frame fr, char * buf, int buf_size, bool print_source_info, int max_frames) Line 80	C++
jvm.dll!NativeStackPrinter::print_stack_from_frame(outputStream * st, char * buf, int buf_size, bool print_source_info, int max_frames) Line 104	C++
jvm.dll!NativeStackPrinter::print_stack(outputStream * st, char * buf, int buf_size, unsigned char * & lastpc, bool print_source_info, int max_frames) Line 40	C++
jvm.dll!JavaThread::print_jni_stack() Line 1775	C++
jvm.dll!check_pending_exception(JavaThread * thr) Line 192	C++
jvm.dll!functionEnter(JavaThread * thr) Line 218	C++
jvm.dll!checked_jni_CallStaticObjectMethod(JNIEnv_ * env, _jclass * clazz, _jmethodID * methodID, ...) Line 1321	C++
nativeStack.dll!generateWarning(const JNINativeInterface_ * * env) Line 66	C
nativeStack.dll!thread_start(void * unused) Line 92	C
ucrtbase.dll!00007ffb0970b028()	Unknown
kernel32.dll!00007ffb0bbd8740()	Unknown
ntdll.dll!RtlUserThreadStart(long(*)(void *) StartAddress, void * Argument) Line 1184	C
Triggering a JNI warning
WARNING: A restricted method in java.lang.System has been called
WARNING: java.lang.System::loadLibrary has been called by TestNativeStack in an unnamed module (file:/C:/java/forks/openjdk/jdk/JTwork/classes/runtime/jni/nativeStack/TestNativeStack.d/)
WARNING: Use --enable-native-access=ALL-UNNAMED to avoid a warning for callers in this module
WARNING: Restricted methods will be blocked in a future release unless native access is enabled

Native thread is running and attaching as daemon ...
About to trigger JNI Warning
WARNING in native method: JNI call made without checking exceptions when required to from CallStaticObjectMethod
Native frames: (J=compiled Java code, j=interpreted, Vv=VM code, C=native code)
V  [jvm.dll+0x10e8aa8]  os::win32::platform_print_native_stack+0x58  (os_windows_aarch64.cpp:143)
V  [jvm.dll+0x10598ac]  os::platform_print_native_stack+0x34  (os_windows_aarch64.inline.hpp:38)
V  [jvm.dll+0x1059588]  NativeStackPrinter::print_stack+0x48  (nativeStackPrinter.cpp:35)
V  [jvm.dll+0xba74a0]  JavaThread::print_jni_stack+0x120  (javaThread.cpp:1775)
V  [jvm.dll+0xcb0e84]  check_pending_exception+0x84  (jniCheck.cpp:192)
V  [jvm.dll+0xcb0f24]  functionEnter+0x4c  (jniCheck.cpp:218)
V  [jvm.dll+0xcbbb70]  checked_jni_CallStaticObjectMethod+0xf0  (jniCheck.cpp:1321)
C  [nativeStack.dll+0x1264]  generateWarning+0x13c  (libnativeStack.c:66)
C  [nativeStack.dll+0x1364]  thread_start+0xa4  (libnativeStack.c:92)
C  [ucrtbase.dll+0x2b028]  (no source info available)
C  [KERNEL32.DLL+0x8740]  (no source info available)
C  [ntdll.dll+0xd47a4]  (no source info available)

Native thread terminating

C:\java\forks\openjdk\jdk\build\windows-aarch64-server-slowdebug\images\jdk\bin\java.exe (process 30308) exited with code 0 (0x0).
To automatically close the console when debugging stops, enable Tools->Options->Debugging->Automatically close the console when debugging stops.
Press any key to close this window . . .
Last month, I investigated OpenJDK gtest failures on Windows. The error message was that the gtests Caught std::exception-derived exception escaping the death test statement. I tracked the commit responsible for the failures to 8343756: CAN_SHOW_REGISTERS_ON_ASSERT for Windows · openjdk/jdk@0054bbe.
// Asserts that a given `statement` causes the program to exit, with an
// integer exit status that satisfies `predicate`, and emitting error output
// that matches `matcher`.
#define ASSERT_EXIT(statement, predicate, matcher) \
  GTEST_DEATH_TEST_(statement, predicate, matcher, GTEST_FATAL_FAILURE_)
I was trying to ensure my understanding of the exit code being an exact match is correct. The line EXPECT_EXIT(_exit(1), testing::ExitedWithCode(1), ""); from googletest/googletest/test/googletest-death-test-test.cc at v1.14.0 · google/googletest supports this hypothesis. The EXPECT_EXIT macro comment (below) left me wondering how ASSERT_EXIT does not continue on to successive tests. The difference between these two macros is in the final parameter, which is GTEST_NONFATAL_FAILURE_ for the EXPECT_EXIT macro.
// Like `ASSERT_EXIT`, but continues on to successive tests in the
// test suite, if any:
#define EXPECT_EXIT(statement, predicate, matcher) \
  GTEST_DEATH_TEST_(statement, predicate, matcher, GTEST_NONFATAL_FAILURE_)
creates a child process with the same executable as the current process to run the death test. The child process is given the –gtest_filter and –gtest_internal_run_death_test flags such that it knows to run the current death test only.
The question now became, why were we catching this std::exception? I asked copilot: how does a windows access violation turn into a std::exception? Part of its answer mentioned the /EHsc compiler flag so I decided to examine the flags used to compile the JVM binaries. I searched for the regex out:[^\s]+jvm.dll in the build logs and found this jvm.dll linker command. Note that 2 separate jvm.dll files get built, one for the product and another for the gtests. The /IMPLIB (Name Import Library) | Microsoft Learn flag was present, but didn’t look relevant.
checking for apk... [not found]
checking for pandoc... [not found]
/cygdrive/d/java/forks/openjdk/jdk/build/.configure-support/generated-configure.sh: line 64028: syntax error: unexpected end of file
configure exiting with result code 2
That file appeared to be truncated??? VSCode was doing something related to building the Java projects in the repo. It is possible that something in VSCode could have interrupted this but I just removed the build folder then reexamined the change.
My include path didn’t appear in the include paths for gtestLauncher.obj! I searched the repo for googlemock and the only place that path could be coming from was CompileGtest.gmk. However, I then noticed that the gtest launcher has its own configuration section. Sheesh. Here is the diff that I used to definitively see how these includes work:
gtestLauncher.exe was now being compiled with -EHsc but the gtests still failed. Since jvm.dll is compiled without -EHsc, I added it to see if the test behavior would change. I started by searching for libjvm in the codebase. This is the additional change I made:
At this point, I looked at the exception handler and it looked like what was happening was that returning EXCEPTION_CONTINUE_EXECUTION let the SEH handler in the gtests continue instead of the code down the report_vm_error path! I decided to create my own handler but needed to look up the syntax. I used Structured Exception Handling (C/C++) | Microsoft Learn.
diff --git a/src/hotspot/share/utilities/debug.hpp b/src/hotspot/share/utilities/debug.hpp
index 12724153659..e40c16c1c59 100644
--- a/src/hotspot/share/utilities/debug.hpp
+++ b/src/hotspot/share/utilities/debug.hpp
@@ -39,7 +39,21 @@ class oopDesc;
 #define CAN_SHOW_REGISTERS_ON_ASSERT
 extern char* g_assert_poison;
 extern const char* g_assert_poison_read_only;
+#if (defined(_WINDOWS))
+// We use structured exception handling when writing to the poison variable.
+// This allows us to continue execution and perform error reporting instead of
+// bailing out to other SEH handlers such as those in the googletest code.
+#include <excpt.h>
+#define TOUCH_ASSERT_POISON                                                  \
+do {                                                                         \
+  __try {                                                                    \
+    (*g_assert_poison) = 'X';                                                \
+  } __except (EXCEPTION_CONTINUE_EXECUTION) {                                \
+  }                                                                          \
+} while (0)
+#else
 #define TOUCH_ASSERT_POISON (*g_assert_poison) = 'X';
+#endif // _WINDOWS
 void initialize_assert_poison();
 void disarm_assert_poison();
 bool handle_assert_poison_fault(const void* ucVoid);
...\jdk\src\hotspot\share\utilities/growableArray.hpp(81): error C2712: Cannot use __try in functions that require object unwinding
...\jdk\src\hotspot\share\classfile/vmClassID.hpp(41): error C3615: constexpr function 'EnumeratorRangeImpl::end_value' cannot result in a constant expression
...\jdk\src\hotspot\share\utilities/enumIterator.hpp(97): note: failure was caused by a statement or an expression that is not valid in a constexpr context
...\jdk\src\hotspot\share\utilities/unsigned5.hpp(190): error C3615: constexpr function 'UNSIGNED5::max_encoded_in_length' cannot result in a constant expression
...\jdk\src\hotspot\share\utilities/unsigned5.hpp(191): note: failure was caused by a statement or an expression that is not valid in a constexpr context
...\jdk\src\hotspot\cpu\x86\register_x86.hpp(61): error C3615: constexpr function 'Register::RegisterImpl::encoding' cannot result in a constant expression
...\jdk\src\hotspot\cpu\x86\register_x86.hpp(61): note: failure was caused by a statement or an expression that is not valid in a constexpr context
...\jdk\src\hotspot\cpu\x86\register_x86.hpp(233): error C3615: constexpr function 'XMMRegister::XMMRegisterImpl::encoding' cannot result in a constant expression
...\jdk\src\hotspot\cpu\x86\register_x86.hpp(233): note: failure was caused by a statement or an expression that is not valid in a constexpr context
...\jdk\src\hotspot\share\runtime/park.hpp(131): error C2712: Cannot use __try in functions that require object unwinding
...\jdk\src\hotspot\share\runtime/mutexLocker.hpp(235): error C2712: Cannot use __try in functions that require object unwinding
...\jdk\src\hotspot\share\runtime/mutexLocker.hpp(240): error C2712: Cannot use __try in functions that require object unwinding
...\jdk\src\hotspot\share\runtime/mutexLocker.hpp(250): error C2712: Cannot use __try in functions that require object unwinding
...\jdk\src\hotspot\share\runtime/mutexLocker.hpp(255): error C2712: Cannot use __try in functions that require object unwinding
At this point, I realized that I needed to disable SEH at the gtest level. I turned off GTEST_HAS_SEH with this change and finally got the gtests to pass!
What was not sure of was whether the JVM reporting code was running (vs the JVM just exiting) and whether there was a narrower way to pass the GTEST_HAS_SEH define – I noticed it in thousands of lines in the compilation log, which might also explain why I was getting error C2712: Cannot use __try in functions that require object unwinding in many more places than I expected when I added the -EHsc flag when compiling jvm.obj. Therefore, it was logical to try to find the minimal diff that would fix the gtests. Here’s one I tried:
This manual approach of finding the minimal change needed was tedious so I decided to add my own defines to see which portions of the gmk files are used and for which compile/link commands:
For location 2, there were 214 lines matching the regex DMYTEST_LOCATION2.+.cpp and 213 lines matching the regex DMYTEST_LOCATION2.+/test/hotspot/gtest/.+.cpp. The location 2 define was therefore correctly scoped to the gtests only. These 213 lines compiled files like test_blocktree.cpp and test_vmerror.cpp. The line that was different between the 2 regexes was the one compiling build/windows-x86_64-server-slowdebug/hotspot/variant-server/libjvm/gtest/objs/BUILD_GTEST_LIBJVM_pch.cpp. Location 3 was only used for compiling test/hotspot/gtest/gtestLauncher.cpp. The challenging case was location 0, which seemed to appear for way more files than it should. Was it really necessary? No it wasn’t! That made life much easier for me.
Inspecting gTest Code Coverage
In the course of this investigation, I considered using time travel debugging to see which code paths were executed. An alternative was to see whether the exception filter code was covered at the end of the gtest execution! The path to the code coverage tool is C:\Program Files\Microsoft Visual Studio\2022\Enterprise\Common7\IDE\Extensions\Microsoft\CodeCoverage.Console\Microsoft.CodeCoverage.Console.exe – it should be in the path by default in the Developer Command Prompt. I kicked it off with these commands:
Search for “exceptionfilter” in the Code Coverage Results pane to view the code coverage for the exception filter.
Verifying Execution Path
The first time I paused execution of the gtests in the debugger, stopped in jdk/src/hotspot/share/utilities/bitMap.cpp. I set a breakpoint there. I liked this location because I could move execution into the failure path (in the assembly view). This was how I saw the gtest structured exception handler kicking in without the JVM’s failure reporting code executing. With the tests now passing, I found the write to the poison location just going through without interruption. Did this mean the test was broken? Or did it mean that the exception filter ran and successfully said to continue execution? I think it has to be the latter but I’ll need time travel debugging to verify this. In the meantime, I sought to at least ensure there were multiple test processes involved.
Verifying Multiple Processes are Started
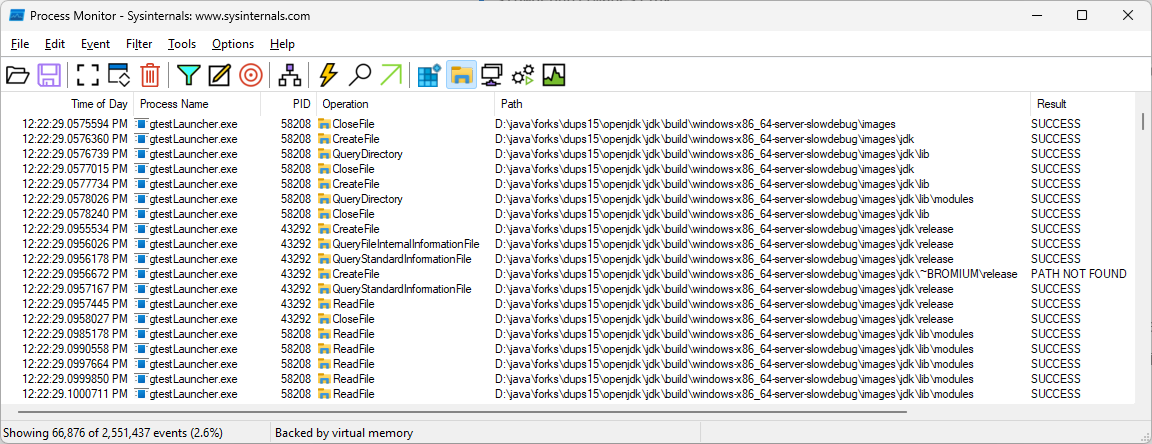
I started Process Monitor and added a filter for path containing “slowdebug”. Notice tons of PIDs for gtestlauncher.exe in the process monitor screenshot below (as expected).
I could successfully execute the error handling path by manually moving the program counter (RIP) after skipping into the failure path of BitMap::verify_range. Why didn’t the PID change in the debugger? Oh wait, was I was still stepping thereby causing recursion? This callstack did not support that hypothesis. Looks like it was just error reporting continuing to execute.
>	jvm.dll!BitMap::verify_range(unsigned __int64 beg, unsigned __int64 end) Line 212	C++
 	jvm.dll!BitMap::clear_range(unsigned __int64 beg, unsigned __int64 end) Line 280	C++
 	jvm.dll!JVMFlag::printFlags(outputStream * out, bool withComments, bool printRanges, bool skipDefaults) Line 706	C++
 	jvm.dll!VMError::report(outputStream * st, bool _verbose) Line 1260	C++
 	jvm.dll!VMError::report_and_die(int id, const char * message, const char * detail_fmt, char * detail_args, Thread * thread, unsigned char * pc, const void * siginfo, const void * context, const char * filename, int lineno, unsigned __int64 size) Line 1847	C++
 	jvm.dll!report_vm_error(const char * file, int line, const char * error_msg, const char * detail_fmt, ...) Line 195	C++
 	jvm.dll!CompressedKlassPointers::check_init<int>(int var) Line 154	C++
 	jvm.dll!CompressedKlassPointers::shift() Line 218	C++
 	jvm.dll!CompressedKlassPointers::print_mode(outputStream * st) Line 301	C++
 	jvm.dll!VMError::report(outputStream * st, bool _verbose) Line 1196	C++
 	jvm.dll!VMError::report_and_die(int id, const char * message, const char * detail_fmt, char * detail_args, Thread * thread, unsigned char * pc, const void * siginfo, const void * context, const char * filename, int lineno, unsigned __int64 size) Line 1847	C++
 	jvm.dll!report_vm_error(const char * file, int line, const char * error_msg, const char * detail_fmt, ...) Line 195	C++
 	jvm.dll!BitMap::verify_limit(unsigned __int64 bit) Line 206	C++
 	jvm.dll!BitMap::to_words_align_down(unsigned __int64 bit) Line 94	C++
 	jvm.dll!BitMap::word_addr(unsigned __int64 bit) Line 144	C++
 	jvm.dll!BitMap::set_bit(unsigned __int64 bit) Line 37	C++
 	jvm.dll!JfrEventVerifier::set_field_bit(unsigned __int64 field_idx) Line 41	C++
 	jvm.dll!JfrEvent<EventTenuringDistribution>::set_field_bit(unsigned __int64 field_idx) Line 267	C++
 	jvm.dll!EventObjectAllocationOutsideTLAB::set_objectClass(const Klass * new_value) Line 7304	C++
 	jvm.dll!trace_flag_changed<bool,EventBooleanFlagChanged>(JVMFlag * flag, const bool old_value, const bool new_value, const JVMFlagOrigin origin) Line 39	C++
 	jvm.dll!TypedFlagAccessImpl<bool,EventBooleanFlagChanged>::check_constraint_and_set(JVMFlag * flag, void * value_addr, JVMFlagOrigin origin, bool verbose) Line 78	C++
 	jvm.dll!FlagAccessImpl_bool::set_impl(JVMFlag * flag, void * value_addr, JVMFlagOrigin origin) Line 98	C++
 	jvm.dll!FlagAccessImpl::set(JVMFlag * flag, void * value, JVMFlagOrigin origin) Line 49	C++
 	jvm.dll!JVMFlagAccess::set_impl(JVMFlag * flag, void * value, JVMFlagOrigin origin) Line 307	C++
 	jvm.dll!JVMFlagAccess::set_or_assert(JVMFlagsEnum flag_enum, int type_enum, void * value, JVMFlagOrigin origin) Line 353	C++
 	jvm.dll!JVMFlagAccess::set<bool,0>(JVMFlagsEnum flag_enum, bool value, JVMFlagOrigin origin) Line 101	C++
 	jvm.dll!Flag_UseLargePagesIndividualAllocation_set(bool value, JVMFlagOrigin origin) Line 69	C++
 	jvm.dll!os::init() Line 4436	C++
 	jvm.dll!Threads::create_vm(JavaVMInitArgs * args, bool * canTryAgain) Line 463	C++
 	jvm.dll!JNI_CreateJavaVM_inner(JavaVM_ * * vm, void * * penv, void * args) Line 3589	C++
 	jvm.dll!JNI_CreateJavaVM(JavaVM_ * * vm, void * * penv, void * args) Line 3680	C++
 	jvm.dll!init_jvm(int argc, char * * argv, bool disable_error_handling, JavaVM_ * * jvm_ptr) Line 94	C++
 	jvm.dll!JVMInitializerListener::OnTestStart(const testing::TestInfo & test_info) Line 124	C++
 	jvm.dll!testing::internal::TestEventRepeater::OnTestStart(const testing::TestInfo & parameter) Line 3858	C++
 	jvm.dll!testing::TestInfo::Run() Line 2821	C++
 	jvm.dll!testing::TestSuite::Run() Line 3015	C++
 	jvm.dll!testing::internal::UnitTestImpl::RunAllTests() Line 5920	C++
 	jvm.dll!testing::internal::HandleSehExceptionsInMethodIfSupported<testing::internal::UnitTestImpl,bool>(testing::internal::UnitTestImpl * object, bool(testing::internal::UnitTestImpl::*)() method, const char * location) Line 2614	C++
 	jvm.dll!testing::internal::HandleExceptionsInMethodIfSupported<testing::internal::UnitTestImpl,bool>(testing::internal::UnitTestImpl * object, bool(testing::internal::UnitTestImpl::*)() method, const char * location) Line 2648	C++
 	jvm.dll!testing::UnitTest::Run() Line 5484	C++
 	jvm.dll!RUN_ALL_TESTS() Line 2317	C++
 	jvm.dll!runUnitTestsInner(int argc, char * * argv) Line 290	C++
 	jvm.dll!runUnitTests(int argc, char * * argv) Line 371	C++
 	gtestLauncher.exe!main(int argc, char * * argv) Line 40	C++
 	[Inline Frame] gtestLauncher.exe!invoke_main() Line 78	C++
 	gtestLauncher.exe!__scrt_common_main_seh() Line 288	C++
 	kernel32.dll!00007ffdcbdce8d7()	Unknown
 	ntdll.dll!00007ffdcc97c34c()	Unknown
One advantage of the stack above is that it showed how the os::init code gets executed (which I was curious about when wondering whether the exception filter was being set up). Disabling the breakpoint just before skipping into the failure path and resuming execution now led to the JVM dying:
[==========] Running 1197 tests from 205 test suites.
[----------] Global test environment set-up.
[----------] 3 tests from AltHashingTest
[ RUN      ] AltHashingTest.halfsiphash_test_ByteArray
[       OK ] AltHashingTest.halfsiphash_test_ByteArray (0 ms)
[ RUN      ] AltHashingTest.halfsiphash_test_CharArray
[       OK ] AltHashingTest.halfsiphash_test_CharArray (0 ms)
[ RUN      ] AltHashingTest.halfsiphash_test_FromReference
[       OK ] AltHashingTest.halfsiphash_test_FromReference (0 ms)
[----------] 3 tests from AltHashingTest (2 ms total)

[----------] 1 test from ThreadsListHandle
[ RUN      ] ThreadsListHandle.sanity_vm
#
# A fatal error has been detected by the Java Runtime Environment:
#
#  Internal Error (d:\java\forks\openjdk\jdk\src\hotspot\share\utilities\bitMap.cpp:208), pid=39132, tid=109872
#  assert(bit <= _size) failed: BitMap limit out of bounds: 0 > 64
#
# JRE version:  ((uninitialized)) (slowdebug build )
# Java VM: OpenJDK 64-Bit Server VM (slowdebug 26-internal-adhoc.saint.jdk, mixed mode, sharing, tiered, compressed class ptrs, unknown gc, windows-amd64)
# Core dump will be written. Default location: D:\java\forks\openjdk\jdk\build\windows-x86_64-server-slowdebug\images\test\hotspot\gtest\server\hs_err_pid39132.mdmp
#
# An error report file with more information is saved as:
# D:\java\forks\openjdk\jdk\build\windows-x86_64-server-slowdebug\images\test\hotspot\gtest\server\hs_err_pid39132.log
#
#

D:\java\forks\openjdk\jdk\build\windows-x86_64-server-slowdebug\images\test\hotspot\gtest\server\gtestLauncher.exe (process 39132) exited with code 1 (0x1).
To automatically close the console when debugging stops, enable Tools->Options->Debugging->Automatically close the console when debugging stops.
Press any key to close this window . . .
c:\progra~1\mib055~1\2022\enterprise\vc\tools\msvc\14.44.35207\include\__msvc_ostream.hpp(781): error C2220: the following warning is treated as an error
c:\progra~1\mib055~1\2022\enterprise\vc\tools\msvc\14.44.35207\include\__msvc_ostream.hpp(781): warning C4530: C++ exception handler used, but unwind semantics are not enabled. Specify /EHsc
c:\progra~1\mib055~1\2022\enterprise\vc\tools\msvc\14.44.35207\include\__msvc_ostream.hpp(781): note: the template instantiation context (the oldest one first) is
c:\repos\googletest\googletest\include\gtest/gtest-message.h(118): note: see reference to function template instantiation 'std::basic_ostream<char,std::char_traits<char>> &std::operator <<<std::char_traits<char>>(std::basic_ostream<char,std::char_traits<char>> &,const char *)' being compiled