Investigating a Windows ZGC Test Failure
[JDK-8334475] UnsafeIntrinsicsTest.java#ZGenerationalDebug assert(!assert_on_failure) failed: Has low-order bits set – Java Bug System (openjdk.org) was brought to my attention a few months ago. I ran the test on commit b3bf31a0a08d on my x64 machine to see what happens:
cd /c/repos/scratchpad/scripts/java/tests

./run-jtreg-tests.sh /d/java/forks/openjdk/jdk /d/java/forks/openjdk/jdk/build/windows-x86_64-server-slowdebug/jdk  /c/java/binaries/jtreg-7.4+1/lib/jtreg.jar
That script shows the exact command line used to invoke the test:
/d/java/forks/openjdk/jdk/build/windows-x86_64-server-slowdebug/jdk/bin/java -Xmx512m -jar /c/java/binaries/jtreg-7.4+1/lib/jtreg.jar -agentvm -ignore:quiet -automatic -xml -vmoption:-Xmx512m -timeoutFactor:4 -concurrency:1 -testjdk:/d/java/forks/openjdk/jdk/build/windows-x86_64-server-slowdebug/jdk -verbose:fail,error,summary test/hotspot/jtreg/compiler/gcbarriers/UnsafeIntrinsicsTest.javaThe test passed on x64 but I wanted to see how to step into the test code itself so I tried this setup in Visual Studio 2022. Unfortunately, it was not straightforward to break into the correct process when launching the test in Visual Studio 2022.
Command: D:\java\forks\openjdk\jdk\build\windows-x86_64-server-slowdebug\jdk\bin\java.exe

Arguments: -Xmx512m -jar C:/java/binaries/jtreg-7.4+1/lib/jtreg.jar -agentvm -ignore:quiet -automatic -xml -vmoption:-Xmx512m -timeoutFactor:4 -concurrency:1 -testjdk:D:/java/forks/openjdk/jdk/build/windows-x86_64-server-slowdebug/jdk -verbose:fail,error,summary  test/hotspot/jtreg/compiler/gcbarriers/UnsafeIntrinsicsTest.java

Working Dir: D:/java/forks/openjdk/jdk
Test Execution Sequence
I decided to try to understand the test execution sequence and started by looking at the output generated when running the jtreg test. Notice that the CreateCoredumpOnCrash product flag is disabled. The first thing I did was to enable it so that there is a core dump to examine.
D:\java\forks\openjdk\jdk\build\windows-x86_64-server-slowdebug\jdk\bin\java
-Dtest.vm.opts=-Xmx512m
-Dtest.tool.vm.opts=-J-Xmx512m
-Dtest.compiler.opts=
-Dtest.java.opts=
-Dtest.jdk=D:\java\forks\openjdk\jdk\build\windows-x86_64-server-slowdebug\jdk
-Dcompile.jdk=D:\java\forks\openjdk\jdk\build\windows-x86_64-server-slowdebug\jdk
-Dtest.timeout.factor=4.0
-Dtest.root=D:\java\forks\openjdk\jdk\test\hotspot\jtreg
-Dtest.name=compiler/gcbarriers/UnsafeIntrinsicsTest.java#ZGenerationalDebug
-Dtest.file=D:\java\forks\openjdk\jdk\test\hotspot\jtreg\compiler\gcbarriers\UnsafeIntrinsicsTest.java
-Dtest.src=D:\java\forks\openjdk\jdk\test\hotspot\jtreg\compiler\gcbarriers
-Dtest.src.path=D:\java\forks\openjdk\jdk\test\hotspot\jtreg\compiler\gcbarriers;D:\java\forks\openjdk\jdk\test\lib
-Dtest.classes=D:\java\forks\openjdk\jdk\JTwork\classes\compiler\gcbarriers\UnsafeIntrinsicsTest_ZGenerationalDebug.d
-Dtest.class.path=D:\java\forks\openjdk\jdk\JTwork\classes\compiler\gcbarriers\UnsafeIntrinsicsTest_ZGenerationalDebug.d;D:\java\forks\openjdk\jdk\JTwork\classes\test\lib
-Dtest.class.path.prefix=D:\java\forks\openjdk\jdk\JTwork\classes\compiler\gcbarriers\UnsafeIntrinsicsTest_ZGenerationalDebug.d;D:\java\forks\openjdk\jdk\test\hotspot\jtreg\compiler\gcbarriers;D:\java\forks\openjdk\jdk\JTwork\classes\test\lib
-Dtest.modules=java.base/jdk.internal.misc:+open --add-modules java.base --add-exports java.base/jdk.internal.misc=ALL-UNNAMED --add-opens java.base/jdk.internal.misc=ALL-UNNAMED
-Xmx512m
-XX:+UseZGC
-XX:+ZGenerational
-XX:+UnlockDiagnosticVMOptions
-XX:+ZVerifyOops
-XX:ZCollectionInterval=1
-XX:-CreateCoredumpOnCrash
-XX:CompileCommand=dontinline,*::mergeImpl* com.sun.javatest.regtest.agent.MainWrapper D:\java\forks\openjdk\jdk\JTwork\compiler\gcbarriers\UnsafeIntrinsicsTest_ZGenerationalDebug.d\main.0.jta
The core dump wasn’t particularly helpful. I worked on simplifying the test so that only the failing scenarios remained. The log in the JBS issue was interpreted code only so I added the -Xint argument and could still reproduce the failure on Windows AArch64.
I came back to the idea of capturing the full command line for the final java.exe process that runs the test. Is there a way to log process start on Windows to capture all command lines? Copilot cited PowerShell and Command Line Logging | LogRhythm, which suggested enabling the use of Event ID 4688: a new process has been created.
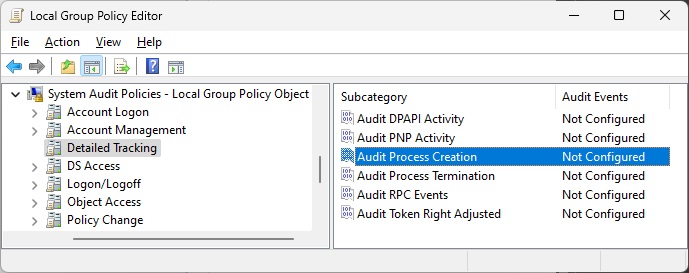
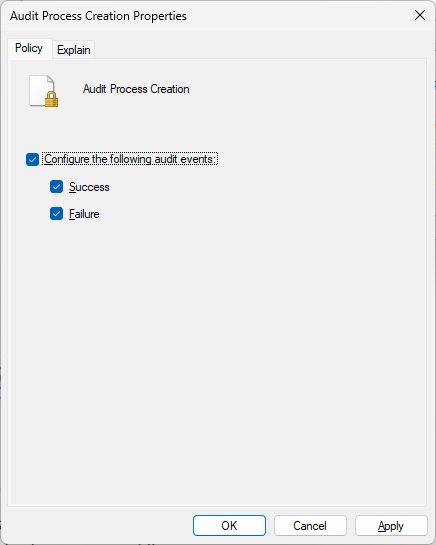
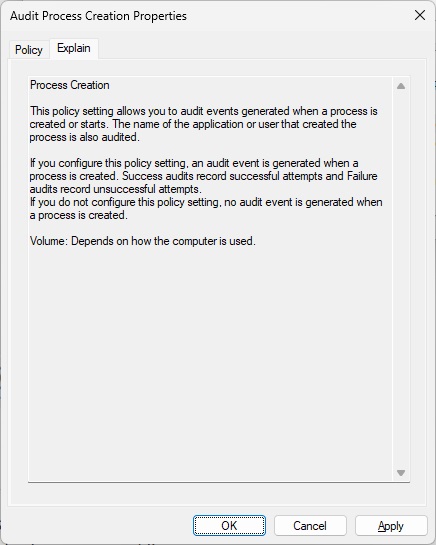
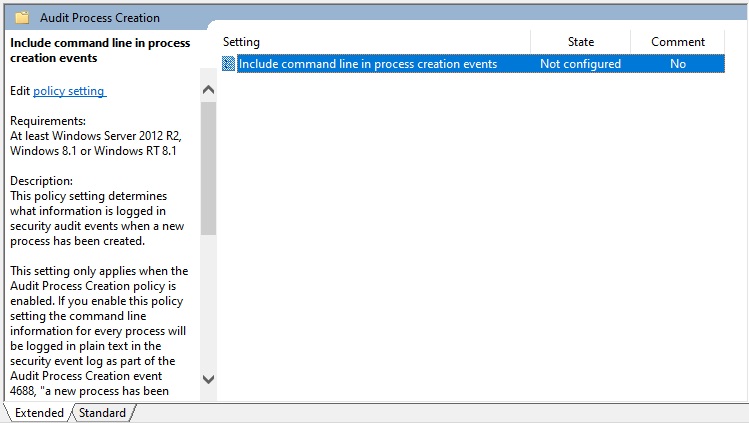
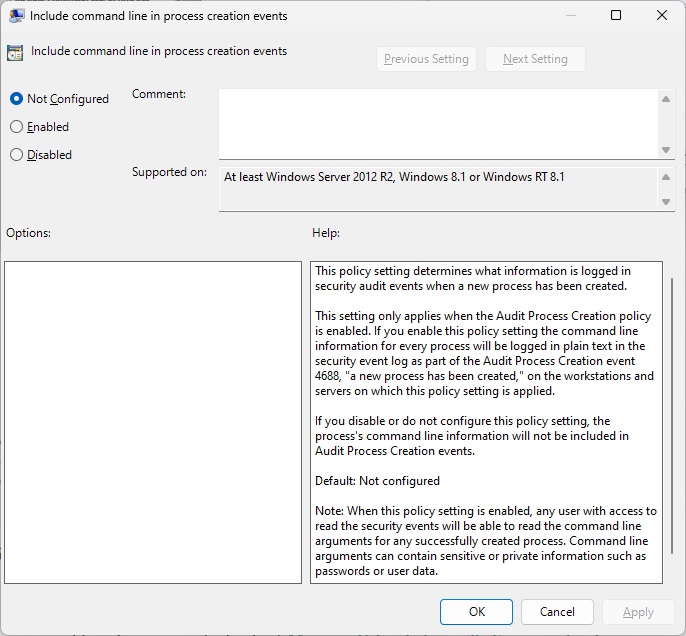
However, the event viewer didn’t have command line arguments when I did this, which is what I needed. I just looked up Event ID 4688 and found 4688(S) A new process has been created. – Windows 10 | Microsoft Learn, which explains that you must enable “Administrative Templates\System\Audit Process Creation\Include command line in process creation events” group policy to include command line in process creation events. Hmm, I definitely didn’t do that when I was investigating this issue. I just tried this and it does the trick!
I went back to deciphering the jtreg test execution output: which class was this com.sun.javatest.regtest.agent.MainWrapper? The only openjdk/jdk match for MainWrapper.java appeared to be jdk/test/hotspot/jtreg/vmTestbase/nsk/share/MainWrapper.java at b3bf31a0a08da679ec2fd21613243fb17b1135a9 · openjdk/jdk (github.com). However, it’s from a different package! Copilot informed me that the MainWrapper class was actually jtreg/src/share/classes/com/sun/javatest/regtest/agent/MainWrapper.java at master · openjdk/jtreg (github.com)
Callstack Investigation
I stepped back to the callstack in the JBS issue and decide to trace it. Here are the links to the sources:
---------------  T H R E A D  ---------------

Current thread (0x0000020efe6a7fb0):  JavaThread "main"             [_thread_in_vm, id=19132, stack(0x0000003c68f00000,0x0000003c69000000) (1024K)]

Stack: [0x0000003c68f00000,0x0000003c69000000]
Native frames: <unavailable>
Java frames: (J=compiled Java code, j=interpreted, Vv=VM code)
j  java.lang.Object.clone()Ljava/lang/Object;+0 java.base
j  java.util.Arrays.copyOfRange([BII)[B+11 java.base
j  java.lang.String.<init>(Ljava/lang/AbstractStringBuilder;Ljava/lang/Void;)V+32 java.base
j  java.lang.StringBuilder.toString()Ljava/lang/String;+16 java.base
j  sun.nio.cs.StandardCharsets.toLower(Ljava/lang/String;)Ljava/lang/String;+121 java.base
j  sun.nio.cs.StandardCharsets.lookup(Ljava/lang/String;)Ljava/nio/charset/Charset;+44 java.base
j  sun.nio.cs.StandardCharsets.charsetForName(Ljava/lang/String;)Ljava/nio/charset/Charset;+6 java.base
j  java.nio.charset.Charset.lookup2(Ljava/lang/String;)Ljava/nio/charset/Charset;+39 java.base
j  java.nio.charset.Charset.lookup(Ljava/lang/String;)Ljava/nio/charset/Charset;+40 java.base
j  java.nio.charset.Charset.isSupported(Ljava/lang/String;)Z+1 java.base
j  java.lang.System.initPhase1()V+37 java.base
v  ~StubRoutines::call_stub 0x0000020e81410180
Lock stack of current Java thread (top to bottom):
LockStack[0]: sun.nio.cs.StandardCharsets
{0x0000040000018d28} - klass: 'sun/nio/cs/StandardCharsets'
 - ---- fields (total size 5 words):
 - private 'classMap' 'Ljava/util/Map;' @16  null (0x0000000000000000)
 - private 'aliasMap' 'Ljava/util/Map;' @24  null (0x0000000000000000)
 - private 'cache' 'Ljava/util/Map;' @32  null (0x0000000000000000)
There is a generated class, sun.nio.cs.StandardCharsets.charsetForName, in the stack above! I was puzzled about why jdk/src/java.base/share/classes/java/nio/charset/StandardCharsets.java at b3bf31a0a08da679ec2fd21613243fb17b1135a9 · openjdk/jdk (github.com) did not contain that method. This failure reminds me of another failure I was investigating a while back:
$JAVA_HOME/bin/java -jar /c/java/binaries/jtreg-7.4+1/lib/jtreg.jar -agentvm -timeoutFactor:4 -concurrency:4 -verbose:fail,error,summary -testjdk:/d/java/forks/openjdk/jdk/build/windows-x86_64-server-release/jdk -nativepath:/d/java/forks/openjdk/jdk/build/windows-x86_64-server-release/support/test/jdk/jtreg/native/lib test/jdk/java/foreign/TestLinker.javaIn the midst of all this wrangling, I decide to write a simple test to spit out the value of the sun.jnu.encoding property. That test runs fine so next step is to use the same flags as the failing jtreg test. However, as I added the ZGC flags to the test command line, I realized that I hadn’t even tried those flags with the java -version. What an oversight! The bug reproduces without running any specific program!
$JAVA_HOME/bin/java -XX:+UseZGC -XX:+ZGenerational -XX:+ZVerifyOops -versionDebugging Minimal Reproducible Failure
Since the assert happens when cloning an array, I decided to find the native implementation of the clone method. Searched for “clone_” and the only relevant hit (from a quick glance) appeared to be in the LinkResolver::check_method_accessability method.
I had been working on the latest commits and decided to try this test on jdk21u. It failed there as well! I tried it on jdk17 but it terminated with “Unrecognized VM option ‘ZGenerational'”. Blaming jdk/src/hotspot/share/gc/shared/gc_globals.hpp at b3bf31a0a08da679ec2fd21613243fb17b1135a9 · openjdk/jdk (github.com) pointed to 8307058: Implementation of Generational ZGC · openjdk/jdk@d20034b (github.com). Looks like jdk21 was the first release with this flag as per [JDK-8307058] Implementation of Generational ZGC – Java Bug System (openjdk.org).
Back to the LinkResolver: it looked like cloning is being dispatched through the Java object but what I had been looking for is a native call. Nothing about cloning at Arrays (Java SE 11 & JDK 11 ) (oracle.com) other than the fact that the method is inherited from the Object class. Nothing helpful in jdk/src/java.base/share/classes/java/util/Arrays.java or jdk/src/java.base/share/classes/java/lang/reflect/Array.java either. jdk/src/java.base/share/native/libjava/Array.c looked promising though. Methods like Java_java_lang_reflect_Array_getByte use the java.lang.reflect.Array JNIEXPORTs declared in jdk/src/hotspot/share/include/jvm.h. Browsing through the corresponding implementations in jdk/src/hotspot/share/prims/jvm.cpp led me to the clone implementation: JVM_Clone! This is the setup I used in the Visual Studio 2022 debugger:
Command: C:/java/forks/openjdk/jdk/build/windows-aarch64-server-slowdebug/jdk/bin/java.exe

Arguments: -XX:+UseZGC -XX:+ZGenerational -XX:+ZVerifyOops -version

Working Dir: C:/java/forks/openjdk/jdk
The failure appeared to be happening in this statement: HeapAccess<>::clone(obj(), new_obj_oop, size). I got this callstack by stepping into the calls in the slowdebug build because the is_valid function is inlined in the fastdebug build, preventing me from setting a breakpoint in it.
jvm.dll!is_valid(zaddress addr, bool assert_on_failure) Line 298	C++
jvm.dll!assert_is_valid(zaddress addr) Line 321	C++
jvm.dll!to_zaddress(unsigned __int64 value) Line 339	C++
jvm.dll!to_zaddress(oopDesc * o) Line 345	C++
jvm.dll!ZBarrierSet::AccessBarrier<270432,ZBarrierSet>::clone_in_heap(oopDesc * src, oopDesc * dst, unsigned __int64 size) Line 433	C++
jvm.dll!AccessInternal::PostRuntimeDispatch<ZBarrierSet::AccessBarrier<270400,ZBarrierSet>,9,270400>::access_barrier(oopDesc * src, oopDesc * dst, unsigned __int64 size) Line 200	C++
jvm.dll!AccessInternal::RuntimeDispatch<270400,oopDesc *,9>::clone_init(oopDesc * src, oopDesc * dst, unsigned __int64 size) Line 349	C++
jvm.dll!AccessInternal::RuntimeDispatch<270400,oopDesc *,9>::clone(oopDesc * src, oopDesc * dst, unsigned __int64 size) Line 533	C++
jvm.dll!AccessInternal::PreRuntimeDispatch::clone<270400>(oopDesc * src, oopDesc * dst, unsigned __int64 size) Line 890	C++
jvm.dll!AccessInternal::clone<262144>(oopDesc * src, oopDesc * dst, unsigned __int64 size) Line 1181	C++
jvm.dll!Access<262144>::clone(oopDesc * src, oopDesc * dst, unsigned __int64 size) Line 212	C++
jvm.dll!JVM_Clone(JNIEnv_ * env, _jobject * handle) Line 698	C++
00000298b2bbf056()	Unknown
00000298a2ee5590()	Unknown
000000c053dfe908()	Unknown
Here’s the stack from stepping into the fastdebug assembly (note that line numbers might be off since this is not slowdebug):
jvm.dll!report_vm_error(const char * file, int line, const char * error_msg, const char * detail_fmt, ...) Line 181	C++
[Inline Frame] jvm.dll!oop::check_oop() Line 89	C++
[Inline Frame] jvm.dll!oop::on_usage() Line 91	C++
[Inline Frame] jvm.dll!oop::obj() Line 103	C++
[Inline Frame] jvm.dll!oop::operator=(const oop &) Line 114	C++
jvm.dll!Copy::pd_conjoint_oops_atomic(const oop * from, oop * to, unsigned __int64 count) Line 120	C++
[Inline Frame] jvm.dll!Copy::pd_conjoint_jlongs_atomic(const __int64 *) Line 106	C++
[Inline Frame] jvm.dll!Copy::conjoint_jlongs_atomic(const __int64 *) Line 142	C++
jvm.dll!AccessInternal::arraycopy_conjoint_atomic<__int64>(__int64 * src, __int64 * dst, unsigned __int64 length) Line 104	C++
jvm.dll!RawAccessBarrier<270432>::clone(oop src, oop dst, unsigned __int64 size) Line 331	C++
[Inline Frame] jvm.dll!BarrierSet::AccessBarrier<270432,ZBarrierSet>::clone_in_heap(oop) Line 313	C++
jvm.dll!ZBarrierSet::AccessBarrier<270432,ZBarrierSet>::clone_in_heap(oop src, oop dst, unsigned __int64 size) Line 451	C++
jvm.dll!AccessInternal::PostRuntimeDispatch<ZBarrierSet::AccessBarrier<270400,ZBarrierSet>,9,270400>::access_barrier(oop src, oop dst, unsigned __int64 size) Line 200	C++
jvm.dll!AccessInternal::RuntimeDispatch<270400,oop,9>::clone_init(oop src, oop dst, unsigned __int64 size) Line 349	C++
[Inline Frame] jvm.dll!AccessInternal::RuntimeDispatch<270400,oop,9>::clone(oop) Line 532	C++
[Inline Frame] jvm.dll!AccessInternal::PreRuntimeDispatch::clone(oop) Line 889	C++
[Inline Frame] jvm.dll!AccessInternal::clone(oop) Line 1180	C++
jvm.dll!Access<262144>::clone(oop src, oop dst, unsigned __int64 size) Line 211	C++
jvm.dll!JVM_Clone(JNIEnv_ * env, _jobject * handle) Line 698	C++
000001a156d3a45c()	Unknown
ZBarrierSet::AccessBarrier<270432,ZBarrierSet>::clone_in_heap is interesting because it verifies that the source is a valid z-address! Let’s take a look at the memory region and see what is there…
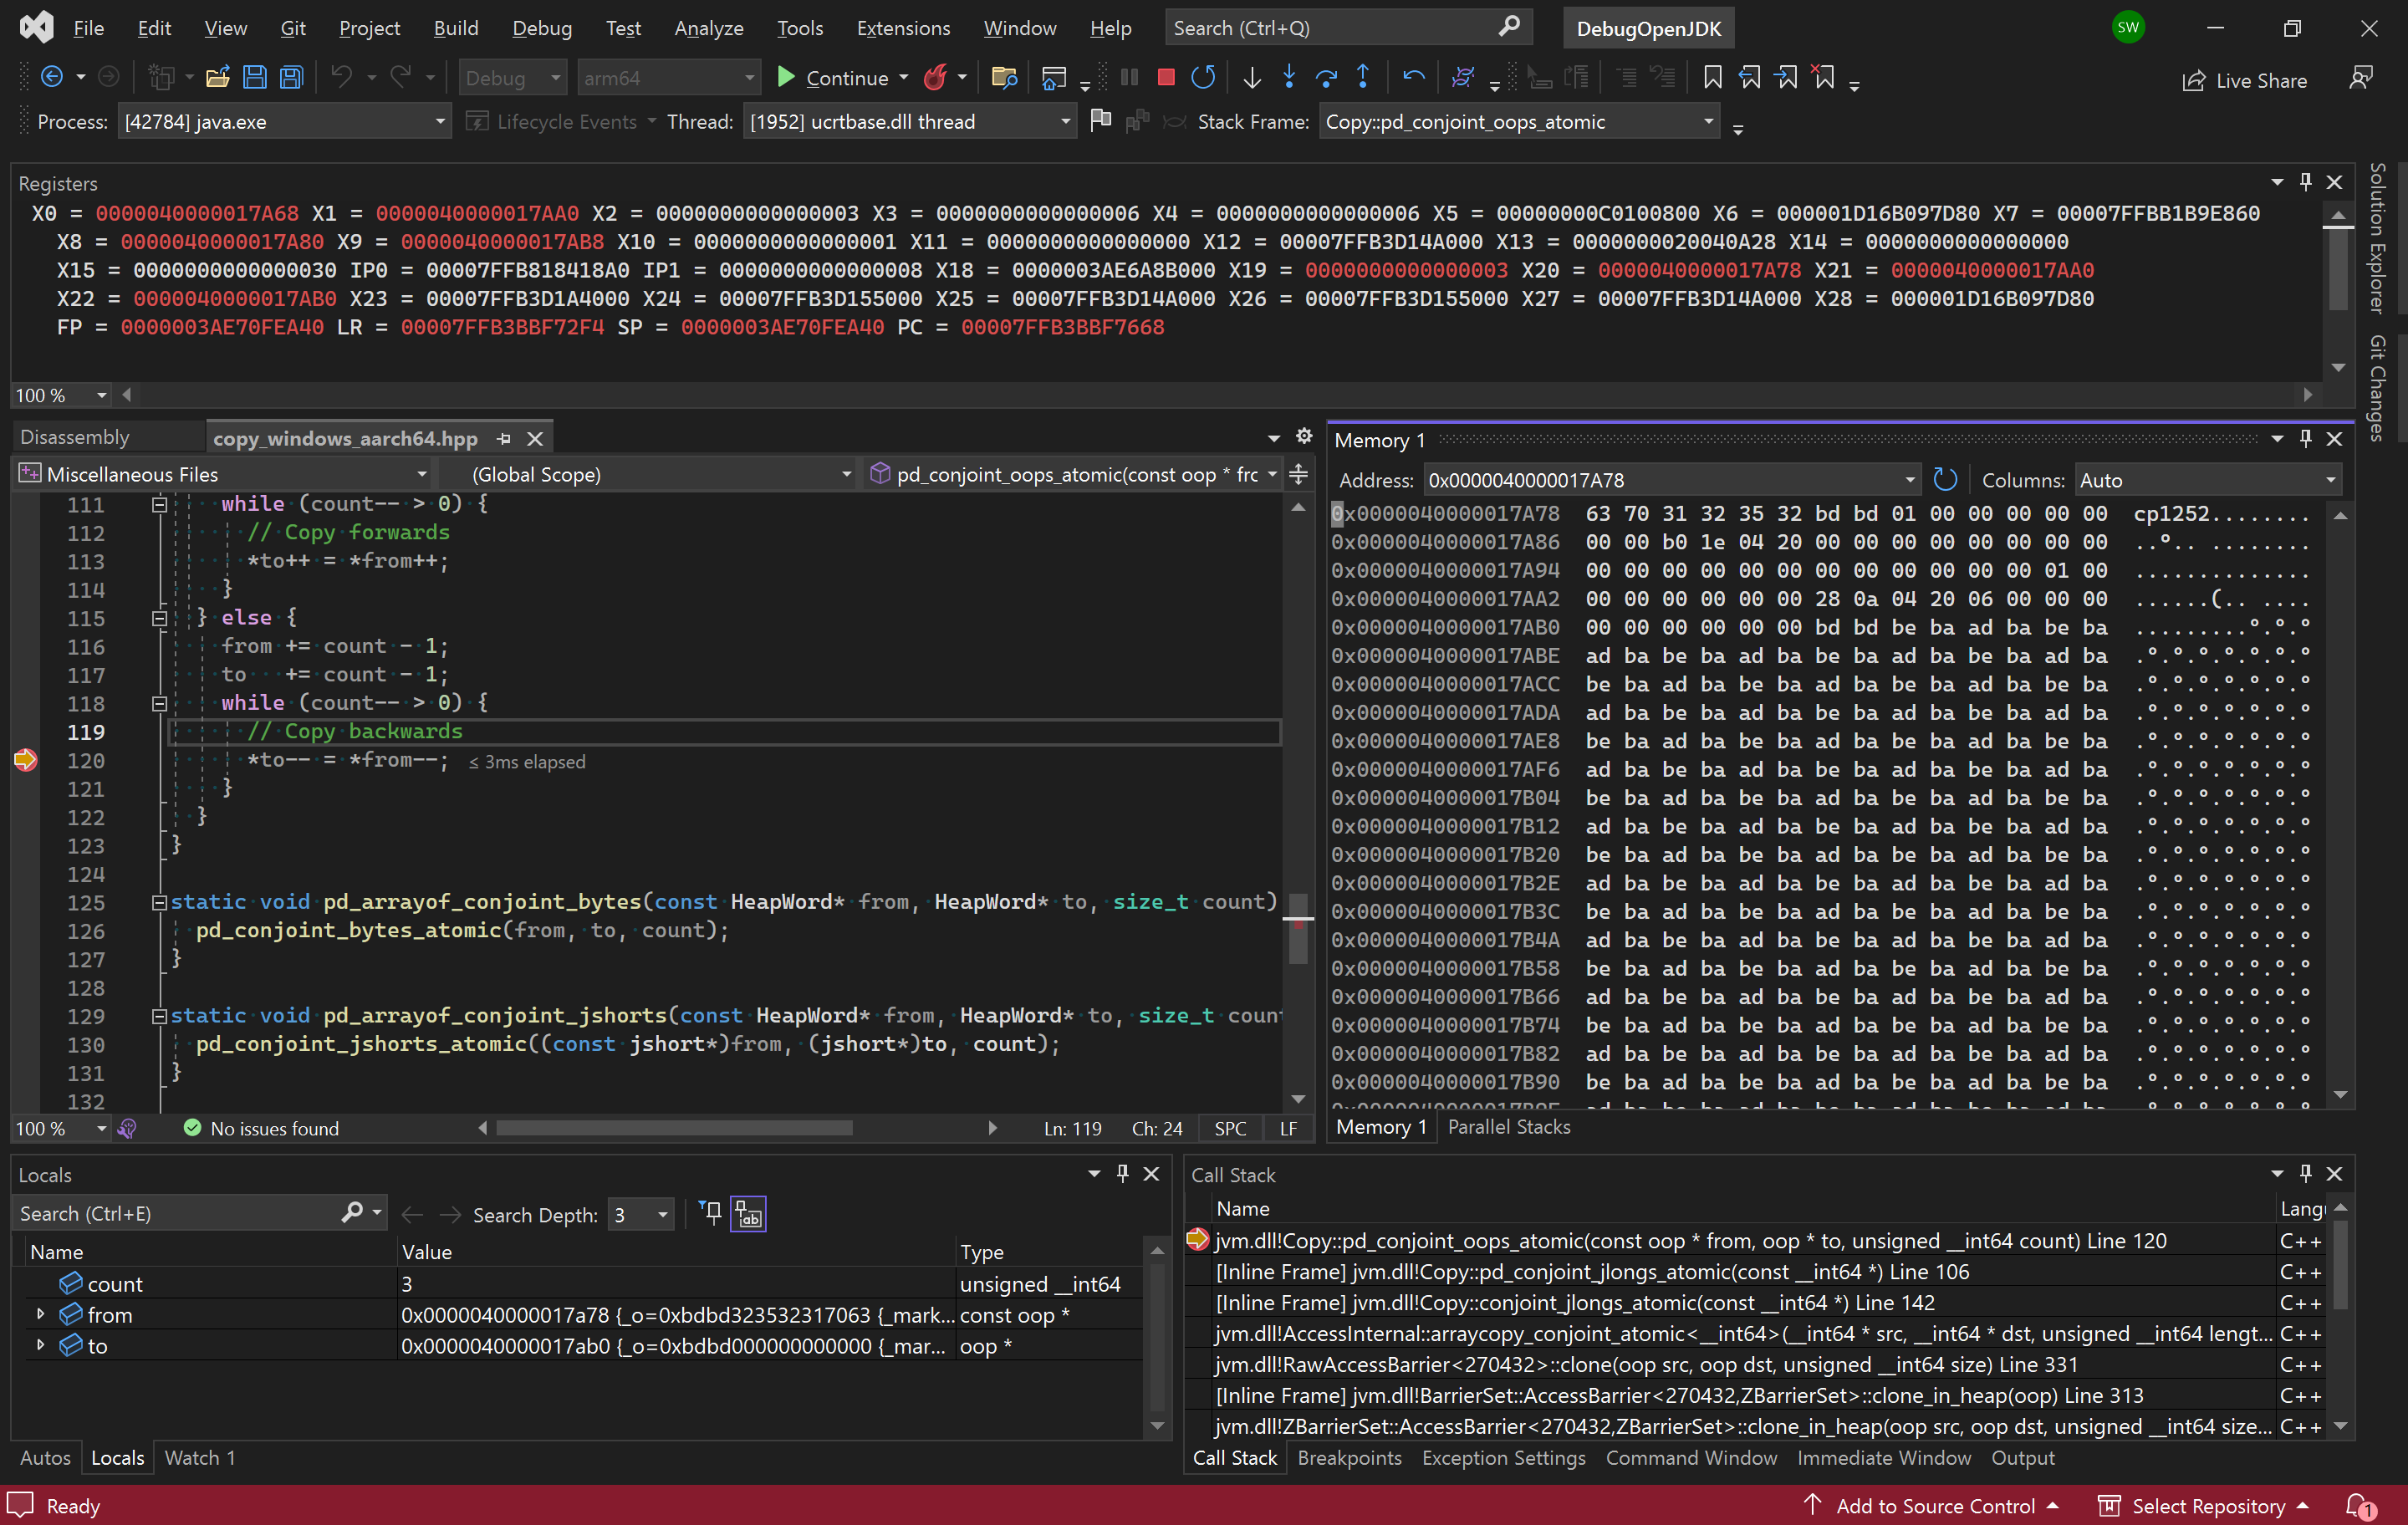
I looked at this and searched for UTF-8 byte 0xBD meaning – Search (bing.com) but that didn’t turn up anything meaningful. I noticed that count is 3 on my Aarch64 device so we are copying 3 oops. Was this expected given that the count is 4 on Windows x64? More importantly though, the big question I have now is why doesn’t slowdebug step into the oop checking code when pressing F11 on line 120 in the screenshot? I expected the behavior of oop::on_usage to be different, not that it wouldn’t be called at all! When browsing the sources in VSCode on my x64 desktop, I clicked on the oop type (of the src argument) and it took me to a typedef of class oopDesc*. That’s when I spotted the CHECK_UNHANDLED_OOPS ifndef. The fastdebug build must have this defined! The only non-cpp/hpp file that contains CHECK_UNHANDLED_OOPS is jdk/make/hotspot/lib/JvmFlags.gmk. Sure enough, it is only defined for fastdebug. This means that I should be able to enable it for slowdebug and release and verify whether the behavior is present there. We can therefore configure a slowdebug build with the --with-extra-cflags=-DCHECK_UNHANDLED_OOPS option.
date; time bash configure --with-jtreg=/cygdrive/c/java/binaries/jtreg-7.4+1 --with-gtest=/cygdrive/c/repos/googletest --with-boot-jdk=/cygdrive/c/java/binaries/jdk/x64/jdk-22.0.1+8 --openjdk-target=aarch64-unknown-cygwin --with-debug-level=slowdebug --with-extra-cflags=-DCHECK_UNHANDLED_OOPS

time /cygdrive/c/repos/scratchpad/scripts/java/cygwin/build-jdk.sh windows aarch64 0 slowdebug
Looking at the actual pointer, I noticed that its value is the data “cp1252..”. After further investigation, I conclude that the bug is that we’re calling oops::operator= instead of just copying the values! I test a fix that simply copies the values directly and it works! The test passes even with the -DCHECK_UNHANDLED_OOPS option!
On to the next question: is there anything else using the pd_conjoint_oops_atomic function (and will it be negatively affected by my change)? While searching for “pd_conjoint_oops_atomic”, I notice that some platforms have an assert that oops == long or smth like that. There are 2 users of pd_conjoint_oops_atomic:
- Copy::pd_conjoint_oops_atomic > AccessInternal::arraycopy_conjoint_oops > RawAccessBarrierArrayCopy::arraycopy. The last method’s definition is based on templates so I continue with a regex search for “Raw::.*arraycopy”. Many of the results are related to arraycopy_in_heap. Looking at all the barrierSet results makes me realize I could just search JBS for “arraycopy_in_heap”.
- pd_arrayof_conjoint_oops in jdk/src/hotspot/os_cpu/windows_aarch64/copy_windows_aarch64.hpp.
One idea is to run Java programs on a build linked with /PROFILE (Performance Tools Profiler) i.e. configured via --with-extra-ldflags=-profile to enable collection of code coverage data then confirming that those functions are executed. That seems cumbersome though so I try to create some array copying code to see if I can get to those functions (using breakpoints but none are hit). After taking a break: I wonder if I can just search from the bottom instead? Looking in jvm.cpp for copy reveals the JVM_ArrayCopy function. Here is my Java program:
public class CopyArray {
    public static void main(String[] args) {
        int length = 0xdeadc0d;
        int srcPos = 0;

        if (args.length > 0) {
            try {
                int userLength = Integer.parseInt(args[0]);
                length = userLength;
            }
            catch (Throwable e) {
                System.err.println("Ignoring invalid user arguments.");
            }
        }

        byte[] src = new byte[length];

        for (int i = 0; i < src.length; i++) {
            src[i] = (byte)(i % 256);
        }
        byte[] dest = new byte[length];
        System.arraycopy(src, srcPos, dest, 0, length);
    }
}
I debugged the JVM running this program on my x64 machine. This hits the target function, JVM_ArrayCopy but there are so many callers. I have to set a condition on the breakpoint (hence the magic value of the length above) before I can step in to see where my call goes. Here are the source paths (note the different commit)
jvm.dll!Copy::pd_conjoint_bytes_atomic(const void * from, void * to, unsigned __int64 count) Line 119	C++
jvm.dll!Copy::conjoint_memory_atomic(const void * from, void * to, unsigned __int64 size) Line 53	C++
jvm.dll!AccessInternal::arraycopy_conjoint_atomic<void>(void * src, void * dst, unsigned __int64 length) Line 164	C++
jvm.dll!RawAccessBarrierArrayCopy::arraycopy<136585312,void>(arrayOop src_obj, unsigned __int64 src_offset_in_bytes, void * src_raw, arrayOop dst_obj, unsigned __int64 dst_offset_in_bytes, void * dst_raw, unsigned __int64 length) Line 298	C++
jvm.dll!RawAccessBarrier<136585312>::arraycopy<void>(arrayOop src_obj, unsigned __int64 src_offset_in_bytes, void * src_raw, arrayOop dst_obj, unsigned __int64 dst_offset_in_bytes, void * dst_raw, unsigned __int64 length) Line 308	C++
jvm.dll!AccessInternal::PreRuntimeDispatch::arraycopy<136587328,void>(arrayOop src_obj, unsigned __int64 src_offset_in_bytes, void * src_raw, arrayOop dst_obj, unsigned __int64 dst_offset_in_bytes, void * dst_raw, unsigned __int64 length) Line 834	C++
jvm.dll!AccessInternal::PreRuntimeDispatch::arraycopy<136585280,void>(arrayOop src_obj, unsigned __int64 src_offset_in_bytes, void * src_raw, arrayOop dst_obj, unsigned __int64 dst_offset_in_bytes, void * dst_raw, unsigned __int64 length) Line 867	C++
jvm.dll!AccessInternal::arraycopy_reduce_types<136585280,void>(arrayOop src_obj, unsigned __int64 src_offset_in_bytes, void * src_raw, arrayOop dst_obj, unsigned __int64 dst_offset_in_bytes, void * dst_raw, unsigned __int64 length) Line 1008	C++
jvm.dll!AccessInternal::arraycopy<136577024,void>(arrayOop src_obj, unsigned __int64 src_offset_in_bytes, const void * src_raw, arrayOop dst_obj, unsigned __int64 dst_offset_in_bytes, void * dst_raw, unsigned __int64 length) Line 1172	C++
jvm.dll!Access<136577024>::arraycopy<void>(arrayOop src_obj, unsigned __int64 src_offset_in_bytes, const void * src_raw, arrayOop dst_obj, unsigned __int64 dst_offset_in_bytes, void * dst_raw, unsigned __int64 length) Line 147	C++
jvm.dll!ArrayAccess<134217728>::arraycopy<void>(arrayOop src_obj, unsigned __int64 src_offset_in_bytes, arrayOop dst_obj, unsigned __int64 dst_offset_in_bytes, unsigned __int64 length) Line 301	C++
jvm.dll!TypeArrayKlass::copy_array(arrayOop s, int src_pos, arrayOop d, int dst_pos, int length, JavaThread * __the_thread__) Line 170	C++
jvm.dll!JVM_ArrayCopy(JNIEnv_ * env, _jclass * ignored, _jobject * src, int src_pos, _jobject * dst, int dst_pos, int length) Line 307	C++
00000244ea690702()	Unknown
Copy::conjoint_memory_atomic is interesting because it has a comment indicating that copying bytes is not aligned and so there is no need to be atomic. The if statements in that method indicate that I can change the size of elements in the array to call different paths. Looks like I need to create an array of objects.
/**
export JAVA_HOME=~/java/binaries/jdk/x64/jdk-21.0.2+13
$JAVA_HOME/bin/javac CopyArray.java
$JAVA_HOME/bin/java CopyArray
 */

public class CopyArray {
    public static void main(String[] args) {
        int length = 0xdead;
        int srcPos = 0;

        if (args.length > 0) {
            try {
                int userLength = Integer.parseInt(args[0]);
                length = userLength;
            }
            catch (Throwable e) {
                System.err.println("Ignoring invalid user arguments.");
            }
        }

        Object[] src = new Object[length];

        for (int i = 0; i < src.length; i++) {
            src[i] = new Object();
        }
        Object[] dest = new Object[length];
        System.arraycopy(src, srcPos, dest, 0, length);
    }
}
Now we are closer to the array_oops code I was trying to hit:
jvm.dll!Copy::pd_conjoint_jints_atomic(const int * from, int * to, unsigned __int64 count) Line 52	C++
jvm.dll!Copy::conjoint_oops_atomic(const narrowOop * from, narrowOop * to, unsigned __int64 count) Line 155	C++
jvm.dll!AccessInternal::arraycopy_conjoint_oops(narrowOop * src, narrowOop * dst, unsigned __int64 length) Line 54	C++
jvm.dll!RawAccessBarrierArrayCopy::arraycopy<50331750,HeapWordImpl *>(arrayOop src_obj, unsigned __int64 src_offset_in_bytes, HeapWordImpl * * src_raw, arrayOop dst_obj, unsigned __int64 dst_offset_in_bytes, HeapWordImpl * * dst_raw, unsigned __int64 length) Line 234	C++
jvm.dll!RawAccessBarrier<52715622>::arraycopy<enum narrowOop>(arrayOop src_obj, unsigned __int64 src_offset_in_bytes, narrowOop * src_raw, arrayOop dst_obj, unsigned __int64 dst_offset_in_bytes, narrowOop * dst_raw, unsigned __int64 length) Line 308	C++
jvm.dll!RawAccessBarrier<52715622>::oop_arraycopy<enum narrowOop>(arrayOop src_obj, unsigned __int64 src_offset_in_bytes, narrowOop * src_raw, arrayOop dst_obj, unsigned __int64 dst_offset_in_bytes, narrowOop * dst_raw, unsigned __int64 length) Line 130	C++
jvm.dll!ModRefBarrierSet::AccessBarrier<35938406,CardTableBarrierSet>::oop_arraycopy_in_heap<enum narrowOop>(arrayOop src_obj, unsigned __int64 src_offset_in_bytes, narrowOop * src_raw, arrayOop dst_obj, unsigned __int64 dst_offset_in_bytes, narrowOop * dst_raw, unsigned __int64 length) Line 109	C++
jvm.dll!AccessInternal::PostRuntimeDispatch<CardTableBarrierSet::AccessBarrier<35938406,CardTableBarrierSet>,8,35938406>::oop_access_barrier<HeapWordImpl *>(arrayOop src_obj, unsigned __int64 src_offset_in_bytes, HeapWordImpl * * src_raw, arrayOop dst_obj, unsigned __int64 dst_offset_in_bytes, HeapWordImpl * * dst_raw, unsigned __int64 length) Line 142	C++
jvm.dll!AccessInternal::RuntimeDispatch<35938374,HeapWordImpl *,8>::arraycopy(arrayOop src_obj, unsigned __int64 src_offset_in_bytes, HeapWordImpl * * src_raw, arrayOop dst_obj, unsigned __int64 dst_offset_in_bytes, HeapWordImpl * * dst_raw, unsigned __int64 length) Line 517	C++
jvm.dll!AccessInternal::PreRuntimeDispatch::arraycopy<35938374,HeapWordImpl *>(arrayOop src_obj, unsigned __int64 src_offset_in_bytes, HeapWordImpl * * src_raw, arrayOop dst_obj, unsigned __int64 dst_offset_in_bytes, HeapWordImpl * * dst_raw, unsigned __int64 length) Line 871	C++
jvm.dll!AccessInternal::arraycopy_reduce_types<35938372>(arrayOop src_obj, unsigned __int64 src_offset_in_bytes, HeapWordImpl * * src_raw, arrayOop dst_obj, unsigned __int64 dst_offset_in_bytes, HeapWordImpl * * dst_raw, unsigned __int64 length) Line 1018	C++
jvm.dll!AccessInternal::arraycopy<35913732,HeapWordImpl *>(arrayOop src_obj, unsigned __int64 src_offset_in_bytes, HeapWordImpl * const * src_raw, arrayOop dst_obj, unsigned __int64 dst_offset_in_bytes, HeapWordImpl * * dst_raw, unsigned __int64 length) Line 1172	C++
jvm.dll!Access<35913728>::oop_arraycopy<HeapWordImpl *>(arrayOop src_obj, unsigned __int64 src_offset_in_bytes, HeapWordImpl * const * src_raw, arrayOop dst_obj, unsigned __int64 dst_offset_in_bytes, HeapWordImpl * * dst_raw, unsigned __int64 length) Line 136	C++
jvm.dll!ArrayAccess<33554432>::oop_arraycopy(arrayOop src_obj, unsigned __int64 src_offset_in_bytes, arrayOop dst_obj, unsigned __int64 dst_offset_in_bytes, unsigned __int64 length) Line 327	C++
jvm.dll!ObjArrayKlass::do_copy(arrayOop s, unsigned __int64 src_offset, arrayOop d, unsigned __int64 dst_offset, int length, JavaThread * __the_thread__) Line 197	C++
jvm.dll!ObjArrayKlass::copy_array(arrayOop s, int src_pos, arrayOop d, int dst_pos, int length, JavaThread * __the_thread__) Line 282	C++
jvm.dll!JVM_ArrayCopy(JNIEnv_ * env, _jclass * ignored, _jobject * src, int src_pos, _jobject * dst, int dst_pos, int length) Line 307	C++
00000202d3f00502()	Unknown
00000202cc269950()	Unknown
In this call stack, the arraycopy_conjoint_oops(narrowOop* src, narrowOop* dst, size_t length) implementation that is called has narrow oops because of the branch in ObjArrayKlass::copy_array. Launch the application using these arguments instead:
C:\java\forks\openjdk\jdk\build\windows-x86_64-server-slowdebug\jdk\bin\java.exe -XX:-UseCompressedOops CopyArrayNow the code block of interest is hit! Hmm, I’m realizing that I should have been explicit about the collector to use. This was debugging the G1 collector (chosen ergonomically).
Notice that ZGC has different code for copying the array on Aarch64 (my fix-jlongs branch based on openjdk/jdk at ee839b7f0ebe471d3877cddd2c87019ccb8ee5ae).
jvm.dll!ZBarrierSet::AccessBarrier<52715590,ZBarrierSet>::oop_arraycopy_in_heap_no_check_cast(zpointer * dst, zpointer * src, unsigned __int64 length) Line 371	C++
jvm.dll!ZBarrierSet::AccessBarrier<35938374,ZBarrierSet>::oop_arraycopy_in_heap(arrayOop src_obj, unsigned __int64 src_offset_in_bytes, zpointer * src_raw, arrayOop dst_obj, unsigned __int64 dst_offset_in_bytes, zpointer * dst_raw, unsigned __int64 length) Line 403	C++
jvm.dll!ZBarrierSet::AccessBarrier<35938374,ZBarrierSet>::oop_arraycopy_in_heap(arrayOop src_obj, unsigned __int64 src_offset_in_bytes, oop * src_raw, arrayOop dst_obj, unsigned __int64 dst_offset_in_bytes, oop * dst_raw, unsigned __int64 length) Line 128	C++
jvm.dll!AccessInternal::PostRuntimeDispatch<ZBarrierSet::AccessBarrier<35938374,ZBarrierSet>,8,35938374>::oop_access_barrier<HeapWordImpl *>(arrayOop src_obj, unsigned __int64 src_offset_in_bytes, HeapWordImpl * * src_raw, arrayOop dst_obj, unsigned __int64 dst_offset_in_bytes, HeapWordImpl * * dst_raw, unsigned __int64 length) Line 142	C++
jvm.dll!AccessInternal::RuntimeDispatch<35938374,HeapWordImpl *,8>::arraycopy(arrayOop src_obj, unsigned __int64 src_offset_in_bytes, HeapWordImpl * * src_raw, arrayOop dst_obj, unsigned __int64 dst_offset_in_bytes, HeapWordImpl * * dst_raw, unsigned __int64 length) Line 517	C++
jvm.dll!AccessInternal::PreRuntimeDispatch::arraycopy<35938374,HeapWordImpl *>(arrayOop src_obj, unsigned __int64 src_offset_in_bytes, HeapWordImpl * * src_raw, arrayOop dst_obj, unsigned __int64 dst_offset_in_bytes, HeapWordImpl * * dst_raw, unsigned __int64 length) Line 871	C++
jvm.dll!AccessInternal::arraycopy_reduce_types<35938372>(arrayOop src_obj, unsigned __int64 src_offset_in_bytes, HeapWordImpl * * src_raw, arrayOop dst_obj, unsigned __int64 dst_offset_in_bytes, HeapWordImpl * * dst_raw, unsigned __int64 length) Line 1018	C++
jvm.dll!AccessInternal::arraycopy<35913732,HeapWordImpl *>(arrayOop src_obj, unsigned __int64 src_offset_in_bytes, HeapWordImpl * const * src_raw, arrayOop dst_obj, unsigned __int64 dst_offset_in_bytes, HeapWordImpl * * dst_raw, unsigned __int64 length) Line 1172	C++
jvm.dll!Access<35913728>::oop_arraycopy<HeapWordImpl *>(arrayOop src_obj, unsigned __int64 src_offset_in_bytes, HeapWordImpl * const * src_raw, arrayOop dst_obj, unsigned __int64 dst_offset_in_bytes, HeapWordImpl * * dst_raw, unsigned __int64 length) Line 136	C++
jvm.dll!ArrayAccess<33554432>::oop_arraycopy(arrayOop src_obj, unsigned __int64 src_offset_in_bytes, arrayOop dst_obj, unsigned __int64 dst_offset_in_bytes, unsigned __int64 length) Line 327	C++
jvm.dll!ObjArrayKlass::do_copy(arrayOop s, unsigned __int64 src_offset, arrayOop d, unsigned __int64 dst_offset, int length, JavaThread * __the_thread__) Line 198	C++
jvm.dll!ObjArrayKlass::copy_array(arrayOop s, int src_pos, arrayOop d, int dst_pos, int length, JavaThread * __the_thread__) Line 290	C++
jvm.dll!JVM_ArrayCopy(JNIEnv_ * env, _jclass * ignored, _jobject * src, int src_pos, _jobject * dst, int dst_pos, int length) Line 308	C++
000002602e8c06a8()	Unknown
I need to turn off compressed oops with the serial collector as well but it looks like there is no check_oop_function for the serial collector. That said, this exploration of array copying code was insightful, showing how the data type sizes determine which path is taken for copying primitives and objects. There didn’t appear to be any red flags about removing the oop::operator= usage so I opened 8334475: UnsafeIntrinsicsTest.java#ZGenerationalDebug assert(!assert_on_failure) failed: Has low-order bits set by swesonga · Pull Request #20390 · openjdk/jdk (github.com) to fix the assertion failure. The most interesting part of this investigation was that the bad address was a data value (cp1252) staring right at me and I missed it. This was quite educational for me though.