mkdir -p ~/java/binaries/jdk/x64
cd ~/java/binaries/jdk/x64
wget https://aka.ms/download-jdk/microsoft-jdk-17.0.7-linux-x64.tar.gz
tar xzf microsoft-jdk-17.0.7-linux-x64.tar.gz
Test the factorization application to verify that the Java build works.
export JAVA_HOME=~/java/binaries/jdk/x64/jdk-17.0.7+7

cd ~/repos/scratchpad/demos/java/FindPrimes
$JAVA_HOME/bin/javac Factorize.java
$JAVA_HOME/bin/java Factorize 123890571352112309857

# Use 4 threads to speed things up
$JAVA_HOME/bin/java Factorize 123890571352112309857 CUSTOM_THREAD_COUNT_VIA_THREAD_CLASS 4
We will need the PrintAssembly option to disassemble the code generated by the compiler when running a Java program. This option requires diagnostic VM options to be unlocked. This is the full command line for generating the disassembly from the application’s execution. The output is redirected to a code.asm file since it can be voluminous.
In the above example, I have used a Java build in a custom path. If you are using a Java build that is already installed, then a few extra steps might be needed to determine where the JAVA_HOME path, e.g.
saint@ubuntuvm:~$ which java
/usr/bin/java
saint@ubuntuvm:~$ ls -l `which java`
saint@ubuntuvm:~$ ls -l /etc/alternatives/java
In the post on Experimenting with Async Profiler, I mentioned the basic (trial division) integer factorization app I wrote. I’ve been experimenting with perf to see what the system looks like when running this application. On Ubuntu, I started with this command:
perf record -F 97 -a -g -- sleep 10
Turns out perf isn’t installed by default.
WARNING: perf not found for kernel 5.19.0-41

  You may need to install the following packages for this specific kernel:
    linux-tools-5.19.0-41-generic
    linux-cloud-tools-5.19.0-41-generic

  You may also want to install one of the following packages to keep up to date:
    linux-tools-generic
    linux-cloud-tools-generic
Interestingly, running sudo apt install linux-tools-generic only picks up 5.17:
...
The following NEW packages will be installed:
  linux-tools-5.15.0-72 linux-tools-5.15.0-72-generic linux-tools-generic
...
which perf now shows /usr/bin/perf but even perf -v fails with the above warning so I have to run
sudo apt install linux-tools-5.19.0-41-generic

...
The following NEW packages will be installed:
  linux-hwe-5.19-tools-5.19.0-41 linux-tools-5.19.0-41-generic
...
Once that completes, perf can now run but perf version doesn’t display anything meaningful. Back to the original command:
perf record -F 97 -a -g -- sleep 10
This fails with an error about restricted access. Interesting reading but I just use sudo and carry on.
Error:
Access to performance monitoring and observability operations is limited.
Consider adjusting /proc/sys/kernel/perf_event_paranoid setting to open
access to performance monitoring and observability operations for processes
without CAP_PERFMON, CAP_SYS_PTRACE or CAP_SYS_ADMIN Linux capability.
More information can be found at 'Perf events and tool security' document:
https://www.kernel.org/doc/html/latest/admin-guide/perf-security.html
perf_event_paranoid setting is 4:
  -1: Allow use of (almost) all events by all users
      Ignore mlock limit after perf_event_mlock_kb without CAP_IPC_LOCK
>= 0: Disallow raw and ftrace function tracepoint access
>= 1: Disallow CPU event access
>= 2: Disallow kernel profiling
To make the adjusted perf_event_paranoid setting permanent preserve it
in /etc/sysctl.conf (e.g. kernel.perf_event_paranoid = <setting>)
Once the command completes, a perf.data file is created in the current directory. To generate a report, run this command. See the sample perf-report.txt file on GitHub.
perf report -n --stdio > perf-report.txt
To generate a flame graph, use Brendan Gregg’s scripts:
cd ~/repos
git clone https://github.com/brendangregg/FlameGraph

cd -

perf script --header > stacks.txt

~/repos/FlameGraph/stackcollapse-perf.pl < stacks.txt | ~/repos/FlameGraph/flamegraph.pl --hash > myflamegraph.svg
I have been studying the performance of a simple Java application (for integer factorization) using async-profiler. The application’s source code is on GitHub.
async-profiler is a low overhead sampling profiler for Java that does not suffer from Safepoint bias problem.
Once the application is running, use the profiler.sh script to attach to the Java process and start profiling it. I was interested in wall clock profiling. This is specified using the -e wall argument (see Part 2: Improving Performance with Async-profiler by Andrei Pangin. – YouTube). The command line below will profile the Java application with a 5ms sampling interval for a duration (-d) of 10 seconds.
# macos:
cd ~/java/binaries/async-profiler-2.9-macos

# Linux:
cd ~/java/binaries/async-profiler-2.9-linux

./profiler.sh -e wall -t -i 5ms -d 10 -f result.html jps
The jps argument above lets the profiler.sh script determine which Java process is running by calling The jps Command (oracle.com). If there are multiple Java processes, then run jps first to determine the process id of the one to be profiled then explicitly pass that pid to profiler.sh e.g.
To find out file types on macos, run file -I rawdata. In my case, I had flamegraph data that was shared as application/gzip (causing unzip to fail with End-of-central-directory signature not found. I needed to use gzip -d rawdata.
We use SymChk to ensure that symbols are available for Windows applications. For the OpenJDK build, this command line can be used to ensure the symbols directory contains symbols for all the Java binaries:
/r causes SymChk to recursively search all subdirectories under the D:\java\binaries\jdk\x64\jdk-17.0.7+7\ directory for program files.
/s specifies the directories containing symbols and multiple directories should be separated with semicolons
Here’s the tail end of the SymChk output:
...
SYMCHK: api-ms-win-crt-utility-l1-1-0.dll FAILED  - api-ms-win-crt-utility-l1-1-0.pdb mismatched or not found
SYMCHK: msvcp140.dll         FAILED  - msvcp140.amd64.pdb mismatched or not found
SYMCHK: ucrtbase.dll         FAILED  - ucrtbase.pdb mismatched or not found
SYMCHK: vcruntime140.dll     FAILED  - vcruntime140.amd64.pdb mismatched or not found
SYMCHK: vcruntime140_1.dll   FAILED  - vcruntime140_1.amd64.pdb mismatched or not found

SYMCHK: FAILED files = 46
SYMCHK: PASSED + IGNORED files = 440
The components that have failures are binaries that are external dependencies of the OpenJDK. Those failures can therefore be safely ignored. An interesting thing to note is that java.dll and java.exe are in the same folder in the OpenJDK installation. Since their symbol files are both called java.pdb, the symbols for java.exe are placed in a subdirectory called exe. This applies to other binaries with similar PDB filename conflicts. See the Symbol Path Syntax section for more details.
The YCSB_COMMAND passed to the Client class is set to -load and -t respectively, for the load and run arguments to the script. The -db argument specified which class to use for the database client. This comes from the second parameter to the script (grep is used to match the script’s 2nd argument with a line in bindings.properties that specifies the corresponding Java class).
Setting up YSCB with a MySQL Database
Database Installation
In addition to the original paper, Planet MySQL also has YCSB results for runs against a MySQL database. The ease of use of a local database prompts me to start out with MySQL as well. Ubuntu docs explain how to Install and configure a MySQL server.
saint@ubuntuvm2:~$ sudo apt install mysql-server
[sudo] password for saint:
Reading package lists... Done
Building dependency tree... Done
Reading state information... Done
The following additional packages will be installed:
  libaio1 libcgi-fast-perl libcgi-pm-perl libevent-core-2.1-7
  libevent-pthreads-2.1-7 libfcgi-bin libfcgi-perl libfcgi0ldbl
  libhtml-template-perl libmecab2 libprotobuf-lite23 mecab-ipadic
  mecab-ipadic-utf8 mecab-utils mysql-client-8.0 mysql-client-core-8.0
  mysql-common mysql-server-8.0 mysql-server-core-8.0
Suggested packages:
  libipc-sharedcache-perl mailx tinyca
The following NEW packages will be installed:
  libaio1 libcgi-fast-perl libcgi-pm-perl libevent-core-2.1-7
  libevent-pthreads-2.1-7 libfcgi-bin libfcgi-perl libfcgi0ldbl
  libhtml-template-perl libmecab2 libprotobuf-lite23 mecab-ipadic
  mecab-ipadic-utf8 mecab-utils mysql-client-8.0 mysql-client-core-8.0
  mysql-common mysql-server mysql-server-8.0 mysql-server-core-8.0
0 upgraded, 20 newly installed, 0 to remove and 2 not upgraded.
Need to get 29.2 MB of archives.
After this operation, 242 MB of additional disk space will be used.
Do you want to continue? [Y/n]
Getting YCSB Sources
Now that MySQL is installed, we need the YCSB sources to run. I started out by cloning the YCSB repo.
mkdir -p ~/java/benchmarks/ycsb
cd ~/java/benchmarks/ycsb
git clone https://github.com/brianfrankcooper/YCSB
cd YCSB
As a Java repo rookie, I simply ran bin/ycsb.sh load basic -P workloads/workloada as mentioned in the readme without realizing that I needed to first build the repo, duh. That failed with this error:
$ export JAVA_HOME=~/java/binaries/jdk/x64/jdk-20+36
$ bin/ycsb.sh load basic -P workloads/workloada

Error: Could not find or load main class site.ycsb.db.JdbcDBCreateTable
Caused by: java.lang.ClassNotFoundException: site.ycsb.db.JdbcDBCreateTable
Use mvn to build the sources:
# Error: Could not find or load main class site.ycsb.db.JdbcDBCreateTable
# https://github.com/brianfrankcooper/YCSB/issues/257#issuecomment-104845560

sudo apt install maven
mvn clean package
I end up with test failures, what do you know?
Getting YCSB Binaries
I decided I might as well just follow the main readme steps and not deal with any build issues.
cd ~/java/benchmarks/ycsb

sudo apt install curl
curl -O --location https://github.com/brianfrankcooper/YCSB/releases/download/0.17.0/ycsb-0.17.0.tar.gz

tar xfvz ycsb-0.17.0.tar.gz
cd ycsb-0.17.0
Launching YCSB
Launch YCSB in the folder from the tar.gz file:
# Notice the version in the path below needs to be updated from what is used at
# https://github.com/brianfrankcooper/YCSB/tree/master/jdbc
#
# The MySQL connectors are at https://dev.mysql.com/downloads/connector/j/?os=26

java -cp jdbc-binding/lib/jdbc-binding-0.17.0.jar:../mysql-connector-j-8.0.32/mysql-connector-j-8.0.32.jar site.ycsb.db.JdbcDBCreateTable -P myjdbc.properties -n ycsbtable
Turns out the driver in the docs is outdated:
Loading class `com.mysql.jdbc.Driver'. This is deprecated. The new driver class is `com.mysql.cj.jdbc.Driver'. The driver is automatically registered via the SPI and manual loading of the driver class is generally unnecessary.
Error in creating table. java.sql.SQLException: Access denied for user 'admin'@'localhost' (using password: YES)
CREATE DATABASE ycsb;
CREATE USER 'ycsbuser'@'localhost' IDENTIFIED BY 'ProfileIt!';
GRANT ALL PRIVILEGES ON * . * TO 'ycsbuser'@'localhost';
Hard to believe but the JdbcDBCreateTable class fails!
losing database connection.
Error in creating table. java.sql.SQLSyntaxErrorException: You have an error in your SQL syntax; check the manual that corresponds to your MySQL server version for the right syntax to use near 'PRIMARY KEY, FIELD0 TEXT, FIELD1 TEXT, FIELD2 TEXT, FIELD3 TEXT, FIELD4 TEXT, FI' at line 1
Loading workload...
Starting test.
Error in initializing the JDBS driver: java.lang.ClassNotFoundException: com.mysql.jdbc.Driver
site.ycsb.DBException: java.lang.ClassNotFoundException: com.mysql.jdbc.Driver
	at site.ycsb.db.JdbcDBClient.init(JdbcDBClient.java:228)
	at site.ycsb.DBWrapper.init(DBWrapper.java:86)
	at site.ycsb.ClientThread.run(ClientThread.java:91)
	at java.base/java.lang.Thread.run(Thread.java:833)
Caused by: java.lang.ClassNotFoundException: com.mysql.jdbc.Driver
	at java.base/jdk.internal.loader.BuiltinClassLoader.loadClass(BuiltinClassLoader.java:641)
	at java.base/jdk.internal.loader.ClassLoaders$AppClassLoader.loadClass(ClassLoaders.java:188)
	at java.base/java.lang.ClassLoader.loadClass(ClassLoader.java:520)
	at java.base/java.lang.Class.forName0(Native Method)
	at java.base/java.lang.Class.forName(Class.java:375)
	at site.ycsb.db.JdbcDBClient.init(JdbcDBClient.java:199)
	... 3 more
bin/ycsb.sh run jdbc -P ../../mysqlworkload.properties
One question that arises is how to control the benchmark running time. There is a maxexecutiontime (in seconds) argument that can be passed to the benchmark.
bin/ycsb.sh run jdbc -P ../../mysqlworkload.properties -p maxexecutiontime=60
The run time is still about 12 seconds and an interesting message is displayed:
Loading workload...
Starting test.
Maximum execution time specified as: 60 secs
Adding shard node URL: jdbc:mysql://127.0.0.1:3306/ycsb
Using shards: 1, batchSize:-1, fetchSize: -1
DBWrapper: report latency for each error is false and specific error codes to track for latency are: []
Could not wait until max specified time, TerminatorThread interrupted.
[OVERALL], RunTime(ms), 6756
Looks like customizing the load is the way to prolong the benchmark:
# The number of records to load into the database initially.
recordcount=1000000

# The target number of operations to perform.
operationcount=10000

# Indicates how many inserts to do if less than recordcount.
# Useful for partitioning the load among multiple servers if the client is the bottleneck.
# Additionally workloads should support the "insertstart" property which tells them which record to start at.
insertcount=10000
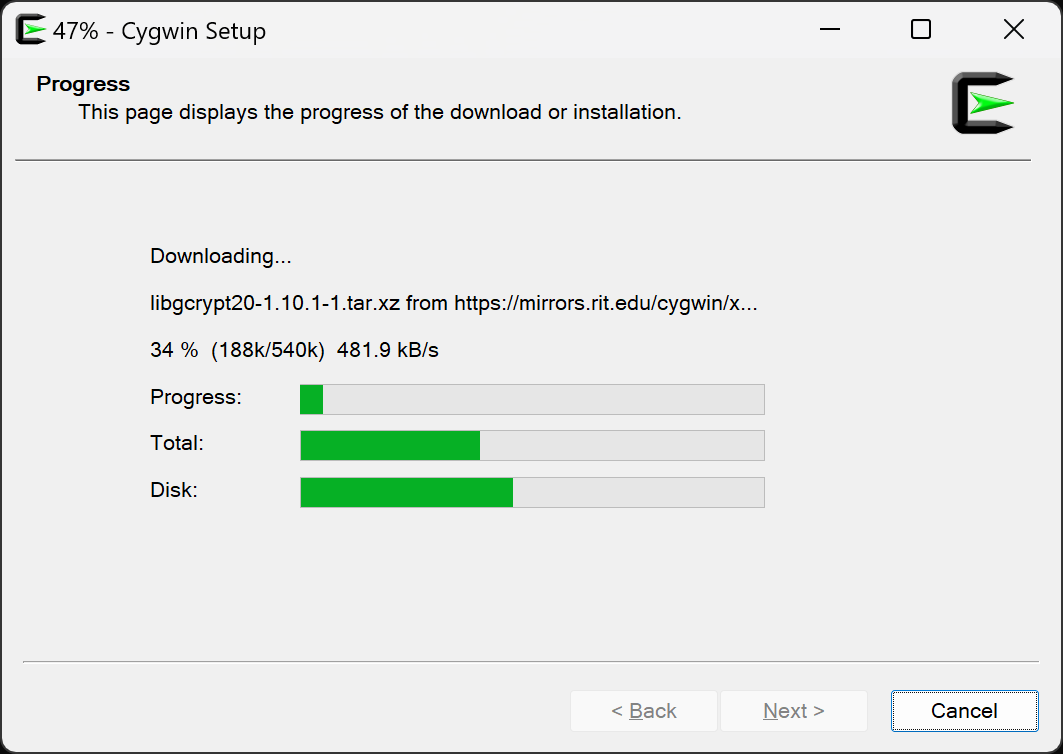
If curl fails with error 23 in Cygwin, it is likely that the curl command shipped with Windows is running in the Cygwin terminal instead of the curl binary distributed with Cygwin. To install the Cywin curl command, run the setup executable with these flags:
setup-x86_64.exe -q -P curl
Background
One of the issues I looked into this week was running an AQAvit™ Verification test on Windows and therefore in Cygwin. Here are the environment variables I set and the commands I executed as outlined on the AQAvit™ Verification page.
The last command above (compilation) failed on my Surface Pro X with this error:
...
Buildfile: C:\java\aqa\aqa-tests\TKG\scripts\build_tools.xml

build:

clean:
   [delete] Deleting directory C:\java\aqa\aqa-tests\TKG\bin

init:
    [mkdir] Created dir: C:\java\aqa\aqa-tests\TKG\bin

getDependentLibs:
     [exec] --------------------------------------------
     [exec] path is set to /cygdrive/c/java/aqa/aqa-tests/TKG/../TKG/lib
     [exec] task is set to default
     [exec] dependencyList is set to json_simple
     [exec] --------------------------------------------
     [exec] Starting download third party dependent jars
     [exec] --------------------------------------------
     [exec] downloading dependent third party jars to /cygdrive/c/java/aqa/aqa-tests/TKG/../TKG/lib
     [exec] downloading https://repo1.maven.org/maven2/com/googlecode/json-simple/json-simple/1.1.1/json-simple-1.1.1.jar
     [exec]   % Total    % Received % Xferd  Average Speed   Time    Time     Time  Current
     [exec]                                  Dload  Upload   Total   Spent    Left  Speed
     [exec]
     [exec]   0     0    0     0    0     0      0      0 --:--:-- --:--:-- --:--:--     0Warning: Failed to open the file Warning: /cygdrive/c/java/aqa/aqa-tests/TKG/../TKG/lib/json-simple.jar: No
     [exec] Warning: such file or directory
     [exec]
     [exec]   5 23931    5  1371    0     0   4483      0  0:00:05 --:--:--  0:00:05  4509curl: (23) Failure writing output to destination
     [exec] ERROR: downloading https://repo1.maven.org/maven2/com/googlecode/json-simple/json-simple/1.1.1/json-simple-1.1.1.jar failed, return code: 5888

BUILD FAILED
C:\java\aqa\aqa-tests\TKG\scripts\build_tools.xml:58: The following error occurred while executing this line:
C:\java\aqa\aqa-tests\TKG\scripts\getDependencies.xml:27: exec returned: 2
I had core.autocrlf set to true when I initially checked out the aqa-tests repo so I suspected the culprit to be a file that didn’t get converted to LF when I ran git add --renormalize as suggested by How do I re-checkout all files in Git to convert from CRLF to LF? – Stack Overflow. I would get errors like “/cygdrive/c/java/aqa/aqa-tests/TKG/scripts/getTestenvProperties.sh: line 14: $’\r’: command not found” and ended up manually changing the line endings using VS Code since there were only 3 files that needed to be changed but I digress…
$ curl -k -o  /c/java/aqa/aqa-tests/TKG/lib/file.jar https://repo1.maven.org/maven2/com/googlecode/json-simple/json-simple/1.1.1/json-simple-1.1.1.jar
  % Total    % Received % Xferd  Average Speed   Time    Time     Time  Current
                                 Dload  Upload   Total   Spent    Left  Speed
  0     0    0     0    0     0      0      0 --:--:-- --:--:-- --:--:--     0Warning: Failed to open the file /c/java/aqa/aqa-tests/TKG/lib/file.jar: No
Warning: such file or directory
  5 23931    5  1371    0     0   4660      0  0:00:05 --:--:--  0:00:05  4679
curl: (23) Failure writing output to destination

$ curl -k -o  ../file.jar https://repo1.maven.org/maven2/com/googlecode/json-simple/json-simple/1.1.1/json-simple-1.1.1.jar
  % Total    % Received % Xferd  Average Speed   Time    Time     Time  Current
                                 Dload  Upload   Total   Spent    Left  Speed
100 23931  100 23931    0     0  84394      0 --:--:-- --:--:-- --:--:-- 84861
Which curl is running? Turns out it’s the native Windows curl command!
I realize there must be a native Cygwin curl package so I install it using this command: \software\setup-x86_64.exe -q -P curl
Installing curl
I end up needing to open a new shell to get it to be picked up when building. That fixes the problem (this version successfully writes the downloaded file to disk)! Here’s the version information for the curl utility installed by Cygwin:
One of my colleagues shared this simple Java program with me.
import java.io.IOException;
import java.io.RandomAccessFile;
import java.nio.channels.FileChannel;

public class TruncateFile {
    public static void main(String[] args) throws IOException {
        RandomAccessFile file = new RandomAccessFile("data.txt", "rw");
        FileChannel channel = file.getChannel();
        channel.map(FileChannel.MapMode.READ_WRITE, 0, 10);
        channel.truncate(9);
    }
}
This program can be launched using source-file mode for convenience: /c/java/binaries/jdk/x64/jdk-19.0.1+10/bin/java.exe TruncateFile.java. It failed with the exception below:
Exception in thread "main" java.io.IOException: The requested operation cannot be performed on a file with a user-mapped section open
        at java.base/sun.nio.ch.FileDispatcherImpl.truncate0(Native Method)
        at java.base/sun.nio.ch.FileDispatcherImpl.truncate(FileDispatcherImpl.java:90)
        at java.base/sun.nio.ch.FileChannelImpl.truncate(FileChannelImpl.java:490)
        at TruncateFile.main(TruncateFile.java:10)
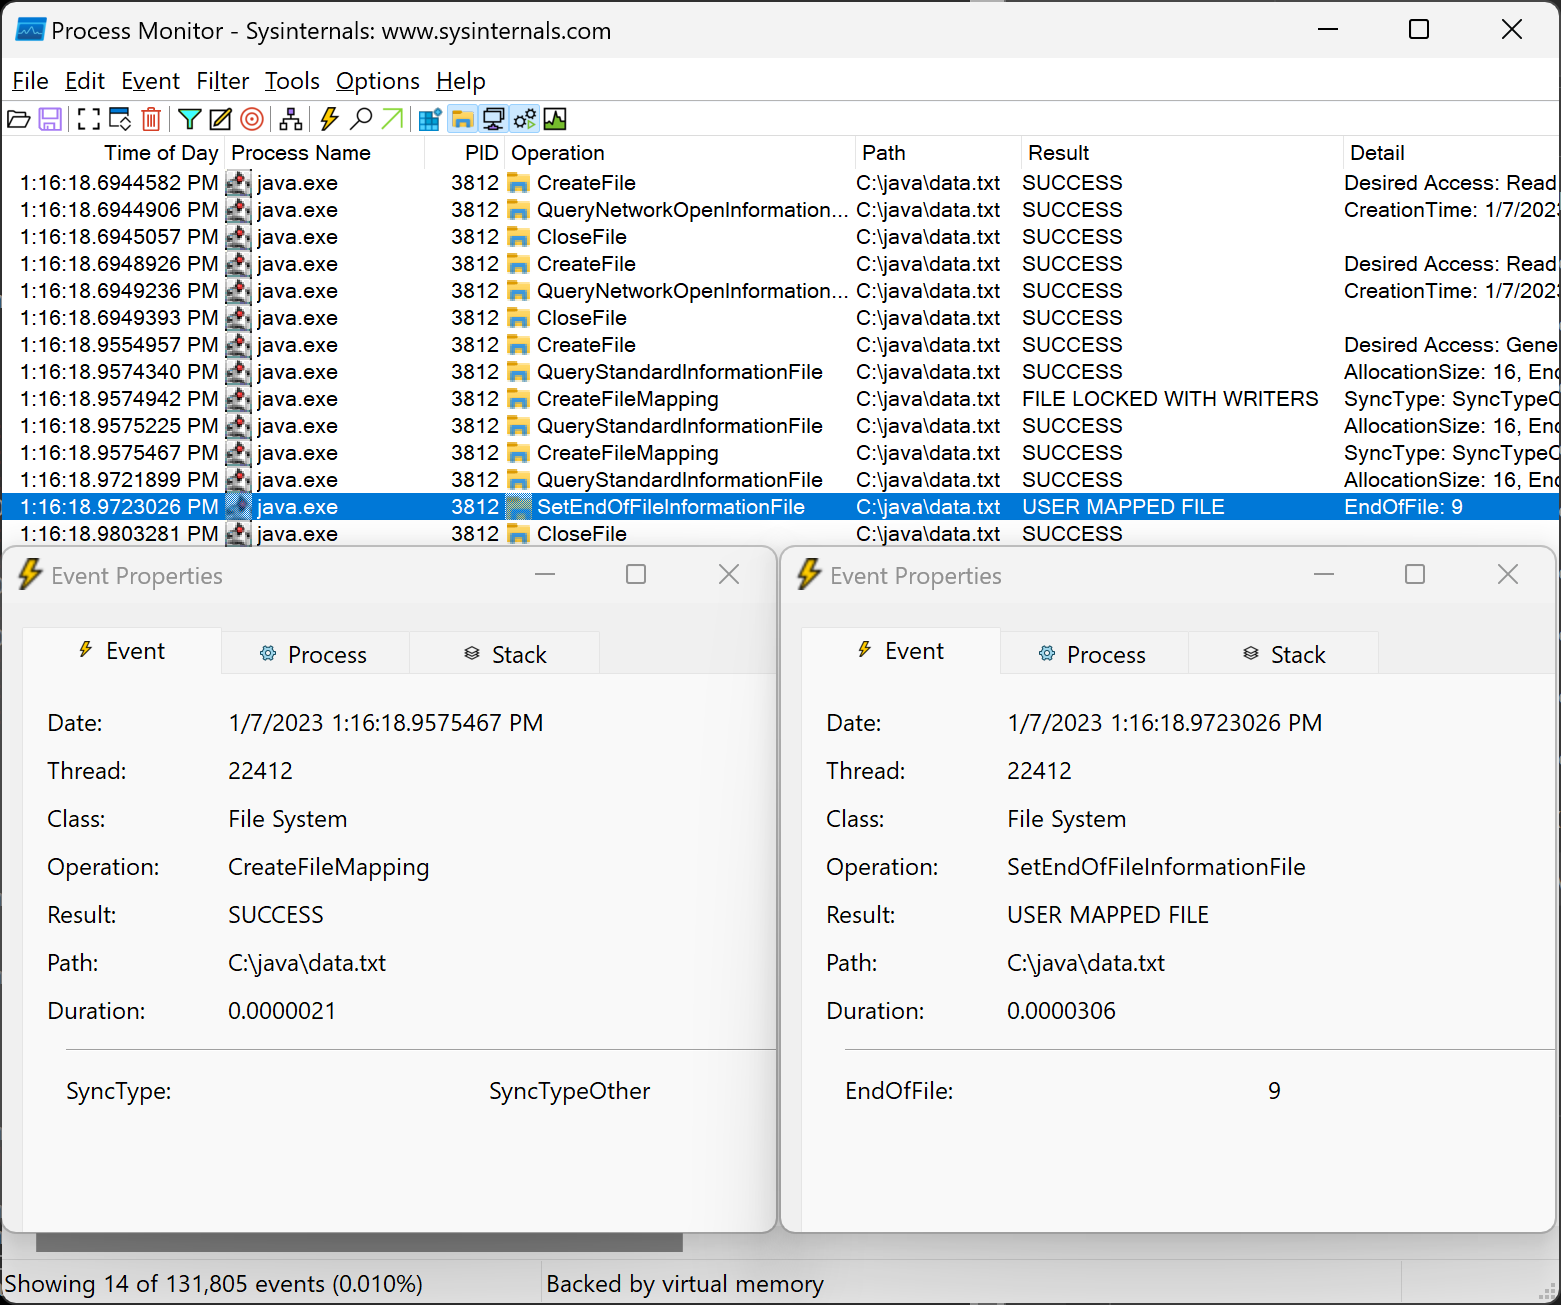
Why does it fail on Windows? I launched Process Monitor, started capturing events, and then ran the above java.exe command and finally stopped capturing events. The SetFileInformationByHandle function failed as indicated by the USER MAPPED FILE entry in its result column.
Process Monitor File Truncation Events
I created a Windows console application, TruncateFile, to also map a file and truncate it using the SetFileInformationByHandle function and therefore get some insight into whether this behavior is the result of a Java bug. Mapping the file using the CreateFileMappingW function indeed fails with ERROR_USER_MAPPED_FILE (The requested operation cannot be performed on a file with a user-mapped section open). This does appear to be a Windows limitation. It is likely the issue another user ran into at Memory mapped file truncation on windows – Stack Overflow.
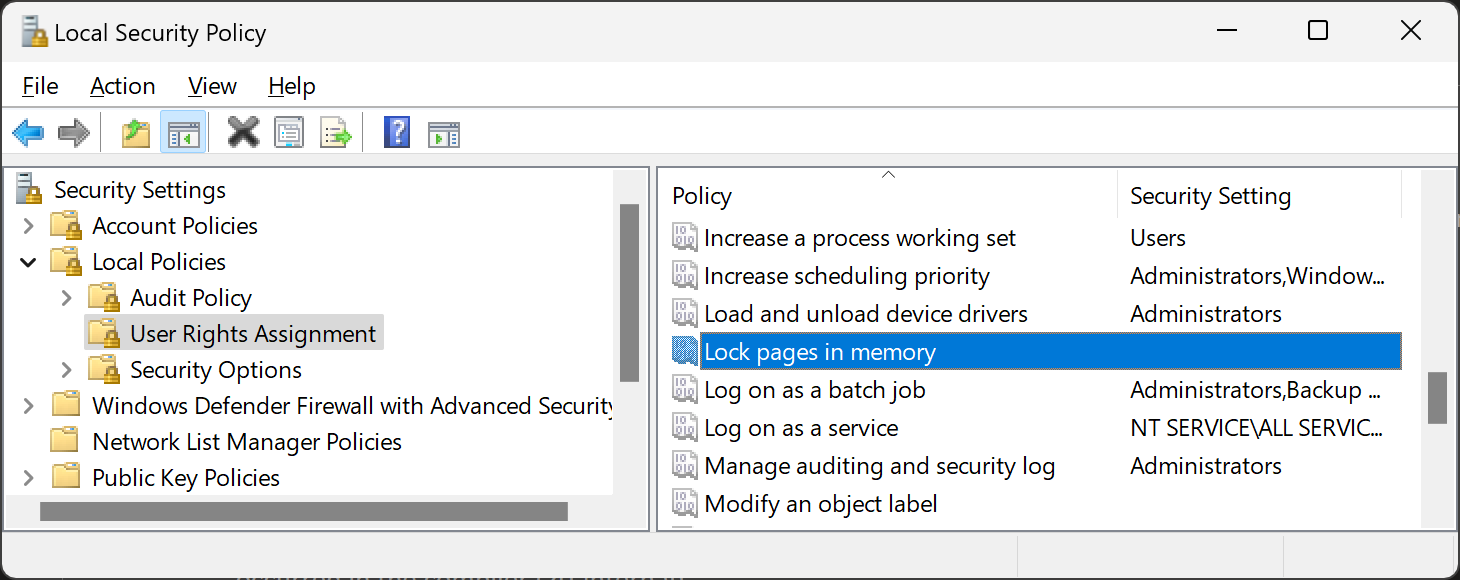
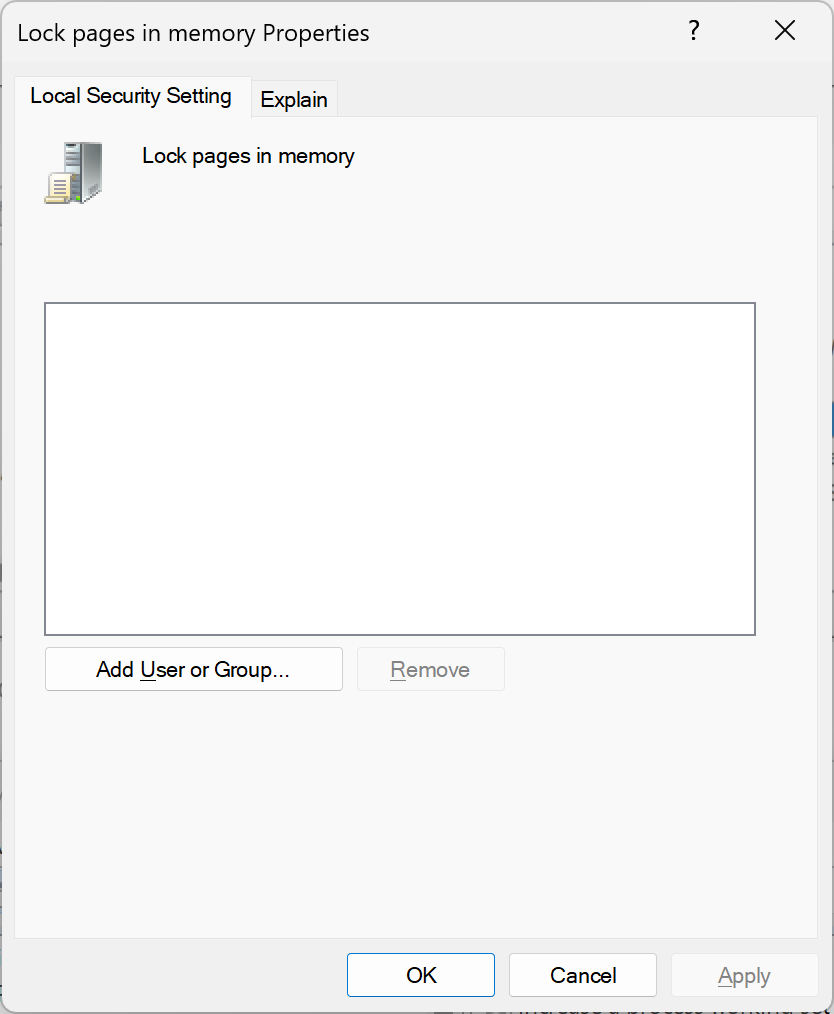
The reason for the error is that the Lock pages in memory policy did not have any allowed users. As documented at AdjustTokenPrivileges, use the Local Security Policy app to change the security policy.
Lock Pages in Memory Security Policy
Adding a User to the “Lock pages in memory” policy
The output I got once the privilege issue was addressed is in the snippet below. To find these message in the source code, run grep -Rin --include *.cpp "Failed to reserve and commit" ./src/.
OpenJDK 64-Bit Server VM warning: Failed to reserve and commit memory using large pages. req_addr: 0x0000000000000000 bytes: 251658240
[0.249s][info][gc,init] CardTable entry size: 512
OpenJDK 64-Bit Server VM warning: Failed to reserve and commit memory using large pages. req_addr: 0x0000000600000000 bytes: 8589934592
OpenJDK 64-Bit Server VM warning: Failed to reserve and commit memory using large pages. req_addr: 0x0000000000000000 bytes: 134217728
OpenJDK 64-Bit Server VM warning: Failed to reserve and commit memory using large pages. req_addr: 0x0000000000000000 bytes: 134217728
[0.374s][info][gc,init] Version: 19.0.1+10 (release)
[0.375s][info][gc,init] CPUs: 12 total, 12 available
[0.375s][info][gc,init] Memory: 32487M
[0.375s][info][gc,init] Large Page Support: Enabled
[0.376s][info][gc,init] NUMA Support: Disabled
[0.376s][info][gc,init] Compressed Oops: Enabled (Zero based)
[0.376s][info][gc,init] Heap Region Size: 4M
[0.377s][info][gc,init] Heap Min Capacity: 8G
[0.377s][info][gc,init] Heap Initial Capacity: 8G
[0.377s][info][gc,init] Heap Max Capacity: 8G
[0.378s][info][gc,init] Pre-touch: Disabled
[0.378s][info][gc,init] Parallel Workers: 10
[0.378s][info][gc,init] Concurrent Workers: 3
[0.379s][info][gc,init] Concurrent Refinement Workers: 10
[0.379s][info][gc,init] Periodic GC: Disabled
openjdk 19.0.1 2022-10-18
OpenJDK Runtime Environment Temurin-19.0.1+10 (build 19.0.1+10)
OpenJDK 64-Bit Server VM Temurin-19.0.1+10 (build 19.0.1+10, mixed mode, sharing)
Here is the call stack where the actual memory reservation happens (the call to the VirtualAlloc function):
jvm.dll!virtualAlloc(void * lpAddress, unsigned __int64 dwSize, unsigned long flAllocationType, unsigned long flProtect)	C++
jvm.dll!reserve_large_pages_single_range(unsigned __int64 size, char * req_addr, bool exec)	C++
jvm.dll!reserve_large_pages(unsigned __int64 size, char * req_addr, bool exec)	C++
jvm.dll!os::pd_reserve_memory_special(unsigned __int64 bytes, unsigned __int64 alignment, unsigned __int64 page_size, char * addr, bool exec)	C++
jvm.dll!os::reserve_memory_special(unsigned __int64 size, unsigned __int64 alignment, unsigned __int64 page_size, char * addr, bool executable)	C++
jvm.dll!reserve_memory_special(char * requested_address, const unsigned __int64 size, const unsigned __int64 alignment, const unsigned __int64 page_size, bool exec)	C++
jvm.dll!ReservedSpace::reserve(unsigned __int64 size, unsigned __int64 alignment, unsigned __int64 page_size, char * requested_address, bool executable)	C++
jvm.dll!ReservedSpace::initialize(unsigned __int64 size, unsigned __int64 alignment, unsigned __int64 page_size, char * requested_address, bool executable)	C++
jvm.dll!ReservedCodeSpace::ReservedCodeSpace(unsigned __int64 r_size, unsigned __int64 rs_align, unsigned __int64 rs_page_size)	C++
jvm.dll!CodeCache::reserve_heap_memory(unsigned __int64 size)	C++
jvm.dll!CodeCache::initialize_heaps()	C++
jvm.dll!CodeCache::initialize()	C++
jvm.dll!codeCache_init()	C++
jvm.dll!init_globals()	C++
jvm.dll!Threads::create_vm(JavaVMInitArgs * args, bool * canTryAgain)	C++
jvm.dll!JNI_CreateJavaVM_inner(JavaVM_ * * vm, void * * penv, void * args)	C++
jvm.dll!JNI_CreateJavaVM(JavaVM_ * * vm, void * * penv, void * args)	C++
jli.dll!InitializeJVM(const JNIInvokeInterface_ * * * pvm, const JNINativeInterface_ * * * penv, InvocationFunctions * ifn)	C
jli.dll!JavaMain(void * _args)	C
jli.dll!ThreadJavaMain(void * args)	C
The virtualAlloc function uses a logging wrapper to capture and log the result of the VirtualAlloc Windows function. It uses a separate logging tag (os). To capture both OS and pagesize logs to disk, use this command:
Here’s a snippet of the beginning of pagesize.txt.
[0.070s][trace][pagesize] Attempt special mapping: size: 240M, alignment: 2M
[0.071s][debug][pagesize] Reserving large pages in a single large chunk.
[0.320s][info ][pagesize] CodeHeap 'non-nmethods':  min=4M max=6M base=0x000002a9c5c00000 page_size=2M size=6M
[0.320s][info ][pagesize] CodeHeap 'profiled nmethods':  min=4M max=116M base=0x000002a9be800000 page_size=2M size=116M
[0.320s][info ][pagesize] CodeHeap 'non-profiled nmethods':  min=4M max=118M base=0x000002a9c6200000 page_size=2M size=118M
[0.324s][trace][pagesize] Attempt special mapping: size: 8G, alignment: 4M
[0.324s][debug][pagesize] Reserving large pages in a single large chunk.
[0.948s][info ][pagesize] Heap:  min=8G max=8G base=0x0000000600000000 page_size=4K size=8G
And below is the beginning of the os.txt log. Notice that the arguments to VirtualAlloc are logged, as well as its return value and the error code when a failure occurs. For example, the 2nd-to-last line shows that the 8GB allocation with large pages failed with error code 1450 (ERROR_NO_SYSTEM_RESOURCES aka Insufficient system resources exist to complete the requested service).
[0.052s][debug][os] Initial active processor count set to 12
[0.059s][trace][os] VirtualAlloc(0x0000000000000000, 8192, 2000, 4) returned 0x000002a9b5c60000.
[0.060s][trace][os] VirtualAlloc(0x000002a9b5c60000, 8192, 1000, 4) returned 0x000002a9b5c60000.
[0.060s][info ][os] SafePoint Polling address, bad (protected) page:0x000002a9b5c60000, good (unprotected) page:0x000002a9b5c61000
[0.065s][trace][os] VirtualAlloc(0x000000bc22600000, 16384, 1000, 4) returned 0x000000bc22600000.
[0.066s][info ][os] attempting shared library load of C:\java\binaries\jdk\x64\jdk-19.0.1+10\bin\java.dll
[0.069s][info ][os] shared library load of C:\java\binaries\jdk\x64\jdk-19.0.1+10\bin\java.dll was successful
[0.319s][trace][os] VirtualAlloc(0x0000000000000000, 251658240, 20003000, 40) returned 0x000002a9be800000.
[0.320s][trace][os] VirtualAlloc(0x0000000000000000, 65536, 2000, 4) returned 0x000002a9b5c80000.
[0.320s][trace][os] VirtualAlloc(0x000002a9b5c80000, 32768, 1000, 4) returned 0x000002a9b5c80000.
[0.320s][trace][os] VirtualAlloc(0x0000000000000000, 983040, 2000, 4) returned 0x000002a9b5c90000.
[0.320s][trace][os] VirtualAlloc(0x000002a9b5c90000, 32768, 1000, 4) returned 0x000002a9b5c90000.
[0.320s][trace][os] VirtualAlloc(0x0000000000000000, 983040, 2000, 4) returned 0x000002a9b5d80000.
[0.320s][trace][os] VirtualAlloc(0x000002a9b5d80000, 32768, 1000, 4) returned 0x000002a9b5d80000.
[0.944s][info ][os] VirtualAlloc(0x0000000600000000, 8589934592, 20003000, 4) failed (1450).
[0.947s][trace][os] VirtualAlloc(0x0000000600000000, 8589934592, 2000, 4) returned 0x0000000600000000.
The JBS bug made it sound like this feature worked in JDK 17 so I ran the same command using JDK 17.0.5.
I wanted to test some recent changes I was making in the OpenJDK repo. Running make test-tier1 failed because I did not specify the location of jtreg when I ran configure using this command on Windows or bash configure on my MacBook M1. I cleaned up the sample commands in the script to specify the --with-jtreg option as explained at jdk/testing.md at master · openjdk/jdk · GitHub.
Building target 'test-tier1' in configuration 'macosx-aarch64-server-release'
Test selection 'tier1', will run:
* jtreg:test/hotspot/jtreg:tier1
* jtreg:test/jdk:tier1
* jtreg:test/langtools:tier1
* jtreg:test/jaxp:tier1
* jtreg:test/lib-test:tier1
Error: jtreg framework is not found.
Please run configure using --with-jtreg.
RunTests.gmk:1027: *** Cannot continue.  Stop.
make[2]: *** [test-tier1] Error 2
To run these tests on macOS, run bash configure --with-jtreg=/Users/saint/java/binaries/jtreg-7.1.1+1. configure does not like the ~/java/… path format for some reason. I also missed the fact that the Gtest suite is included in the tier1 tests. Therefore, I got errors like:
--------------------------------------------------
TEST: gtest/GTestWrapper.java
TEST JDK: /Users/saint/repos/java/forks/panama-foreign/build/macosx-aarch64-server-release/images/jdk
...
...
...=---==]=============
java.lang.Error: TESTBUG: the library has not been found in /Users/saint/repos/java/forks/panama-foreign/build/macosx-aarch64-server-release/images/test/hotspot/jtreg/native. Did you forget to use --with-gtest to configure?
	at GTestWrapper.main(GTestWrapper.java:62)
	at java.base/jdk.internal.reflect.DirectMethodHandleAccessor.invoke(DirectMethodHandleAccessor.java:104)
	at java.base/java.lang.reflect.Method.invoke(Method.java:578)
	at com.sun.javatest.regtest.agent.MainActionHelper$AgentVMRunnable.run(MainActionHelper.java:312)
	at java.base/java.lang.Thread.run(Thread.java:1623)

JavaTest Message: Test threw exception: java.lang.Error
JavaTest Message: shutting down test
cd ~/repos
git clone -b release-1.8.1 https://github.com/google/googletest

cd ~/repos/java/forks/panama-foreign
bash configure --with-debug-level=slowdebug \
 --with-jtreg=/Users/saint/java/binaries/jtreg-7.1.1+1 \
 --with-gtest=/Users/saint/repos/googletest

make test-tier1
On Windows, I time the commands (out of my own curiosity) since they take much longer to run on my hardware:
cd /c/repos
git clone -b release-1.8.1 https://github.com/google/googletest

cd /cygdrive/c/java/forks/panama-foreign
time bash configure --with-debug-level=slowdebug \
 --with-jtreg=/cygdrive/c/java/binaries/jtreg-7.1.1+1 \
 --with-gtest=/cygdrive/c/repos/googletest

time make test-tier1
gtest Failure on macOS
make test-tier1 fails on macOS due to errors in the googletest sources. Here is a snippet of the configure output showing the C and C++ compiler versions in use:
configure: Using default toolchain clang (clang/LLVM)
checking for clang... /usr/bin/clang
checking resolved symbolic links for CC... no symlink
configure: Using clang C compiler version 13.1.6 [Apple clang version 13.1.6 (clang-1316.0.21.2.5) Target: arm64-apple-darwin21.2.0 Thread model: posix InstalledDir: /Applications/Xcode.app/Contents/Developer/Toolchains/XcodeDefault.xctoolchain/usr/bin]
checking whether the C compiler works... yes
checking for C compiler default output file name... a.out
checking for suffix of executables...
checking whether we are cross compiling... no
checking for suffix of object files... o
checking whether the compiler supports GNU C... yes
checking whether /usr/bin/clang accepts -g... yes
checking for /usr/bin/clang option to enable C11 features... none needed
checking for clang++... /usr/bin/clang++
checking resolved symbolic links for CXX... no symlink
configure: Using clang C++ compiler version 13.1.6 [Apple clang version 13.1.6 (clang-1316.0.21.2.5) Target: arm64-apple-darwin21.2.0 Thread model: posix InstalledDir: /Applications/Xcode.app/Contents/Developer/Toolchains/XcodeDefault.xctoolchain/usr/bin]
checking whether the compiler supports GNU C++... yes
checking whether /usr/bin/clang++ accepts -g... yes
checking for /usr/bin/clang++ option to enable C++11 features... none needed
checking how to run the C preprocessor... /usr/bin/clang -E
checking how to run the C++ preprocessor... /usr/bin/clang++ -E
configure: Using clang linker version 764 [@(#)PROGRAM:ld  PROJECT:ld64-764]
checking for ar... /usr/bin/ar
The errors are about implicit copy constructors like in the example below. The build fails because there are too many errors (all related to this warning).
Creating hotspot/variant-server/libjvm/gtest/gtestLauncher from 1 file(s)
In file included from /Users/saint/repos/googletest/googlemock/src/gmock-all.cc:39:
In file included from /Users/saint/repos/googletest/googlemock/include/gmock/gmock.h:59:
/Users/saint/repos/googletest/googlemock/include/gmock/gmock-actions.h:484:3: error: definition of implicit copy constructor for 'PolymorphicAction<testing::internal::ReturnNullAction>' is deprecated because it has a user-declared copy assignment operator [-Werror,-Wdeprecated-copy]
  GTEST_DISALLOW_ASSIGN_(PolymorphicAction);
  ^
/Users/saint/repos/googletest/googletest/include/gtest/internal/gtest-port.h:928:8: note: expanded from macro 'GTEST_DISALLOW_ASSIGN_'
  void operator=(type const &) GTEST_CXX11_EQUALS_DELETE_
       ^
/Users/saint/repos/googletest/googlemock/include/gmock/gmock-actions.h:1125:10: note: in implicit copy constructor for 'testing::PolymorphicAction<testing::internal::ReturnNullAction>' first required here
  return MakePolymorphicAction(internal::ReturnNullAction());
         ^
/Users/saint/repos/googletest/googlemock/include/gmock/gmock-actions.h:484:3: error: definition of implicit copy constructor for 'PolymorphicAction<testing::internal::ReturnVoidAction>' is deprecated because it has a user-declared copy assignment operator [-Werror,-Wdeprecated-copy]
  GTEST_DISALLOW_ASSIGN_(PolymorphicAction);
  ^
/Users/saint/repos/googletest/googletest/include/gtest/internal/gtest-port.h:928:8: note: expanded from macro 'GTEST_DISALLOW_ASSIGN_'
  void operator=(type const &) GTEST_CXX11_EQUALS_DELETE_
       ^
/Users/saint/repos/googletest/googlemock/include/gmock/gmock-actions.h:1130:10: note: in implicit copy constructor for 'testing::PolymorphicAction<testing::internal::ReturnVoidAction>' first required here
  return MakePolymorphicAction(internal::ReturnVoidAction());
         ^
In file included from /Users/saint/repos/googletest/googlemock/src/gmock-all.cc:39:
In file included from /Users/saint/repos/googletest/googlemock/include/gmock/gmock.h:62:
In file included from /Users/saint/repos/googletest/googlemock/include/gmock/gmock-generated-function-mockers.h:44:
In file included from /Users/saint/repos/googletest/googlemock/include/gmock/gmock-spec-builders.h:71:
Creating hotspot/variant-server/libjvm/libgtest/libgtest.a from 1 file(s)
/Users/saint/repos/java/forks/panama-foreign/test/hotspot/gtest/gtestMain.cpp:233:7: error: no member named 'FLAGS_gtest_internal_run_death_test' in namespace 'testing::internal'; did you mean 'testing::FLAGS_gtest_internal_run_death_test'?
  if (::testing::internal::GTEST_FLAG(internal_run_death_test).length() > 0) {
      ^~~~~~~~~~~~~~~~~~~~~~~~~~~~~~~~~~~~~~~~~~~~~~~~~~~~~~~~
      testing::FLAGS_gtest_internal_run_death_test
Looks like this will need some additional tweaks to get the macOS tests to run successfully. However, the tests on Windows x64 ran successfully and that was enough for what I was investigating.
Update: gtest Failure on Windows
I tried setting up a build environment on a new Windows machine and got this error about the gtest version from bash configure.
checking for gtest... /cygdrive/c/repos/googletest
configure: error: gtest at /cygdrive/c/repos/googletest does not seem to be version 1.8.1
configure exiting with result code 1
configure detects the googletest version by grepping the googletests CMakeLists.txt for GOOGLETEST_VERSION then using a regex to replace the whole line with the version number only.
grep GOOGLETEST_VERSION /cygdrive/c/repos/googletest/CMakeLists.txt | sed -E -e 's/set\(GOOGLETEST_VERSION (.*)\)/\1/'
The output is the string 1.9.0 as expected. Wondering if this is a line ending issue, I switch CMakeLists.txt to the Unix line endings using Notepad++. The new error below means that was indeed the issue!