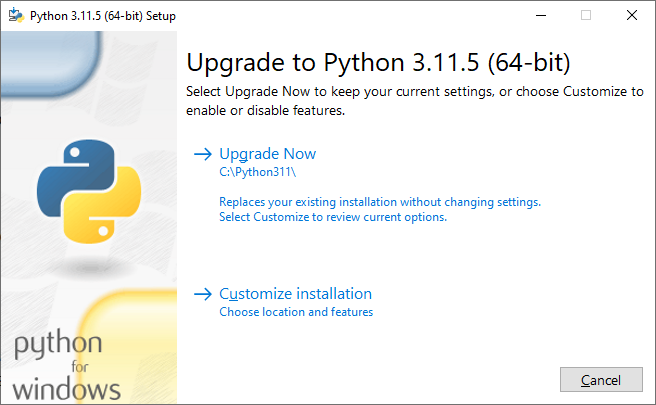
The 8353009: Improve documentation for Windows AArch64 builds PR has a comment stating that “the BuildTools distribution of Visual Studio do not include aarch64-hosted compilers, so to be able to run native builds without the Prism emulation, you need to install the full Visual Studio, including the IDE.” This post describes how I determined this to be false.
Running bash configure --with-boot-jdk=<PATH> failed with the error that it could not find a C compiler:
...
checking for cacerts file... default
checking for cacerts source... default
checking for --enable-unlimited-crypto... enabled, default
checking for jni library path... default
configure: Using default toolchain microsoft (Microsoft Visual Studio)
configure: Found Visual Studio installation at /cygdrive/c/progra~2/micros~2/2022/BuildTools using well-known name
configure: Found Microsoft Visual Studio 2022
configure: Trying to extract Visual Studio environment variables for aarch64
configure: using /cygdrive/c/progra~2/micros~2/2022/BuildTools/vc/auxiliary/build/vcvarsarm64.bat
configure: Setting extracted environment variables for aarch64
checking that Visual Studio variables have been correctly extracted... ok
checking for cl... [not found]
configure: error: Could not find a C compiler.
configure exiting with result code 1
The TOOLCHAIN_FIND_COMPILER macro calls the UTIL_LOOKUP_TOOLCHAIN_PROGS macro to find the C compiler. I verified that the last argument is “cl” with an AC_MSG_NOTICE. At this point, I compared the TOOLCHAIN_PATH in config.log with that on a different ARM64 machine with a full VS install. Sure enough, it didn’t contain the bin/hostarm64/arm64 path with the buildtools setup, even though the path exists on disk. TOOLCHAIN_PATH is coming from VS_PATH in toolchain_microsoft.m4. Here is the build\windows-aarch64-server-slowdebug\configure-support\vs-env-aarch64\set-vs-env.sh file.
Notice that VS_PATH only has what VS_ENV_CMD added to the PATH! This was a clue that I need to take another step back – I realized that I couldn’t even run cl.exe in the developer command prompt! Then again, the command line for the terminal is:
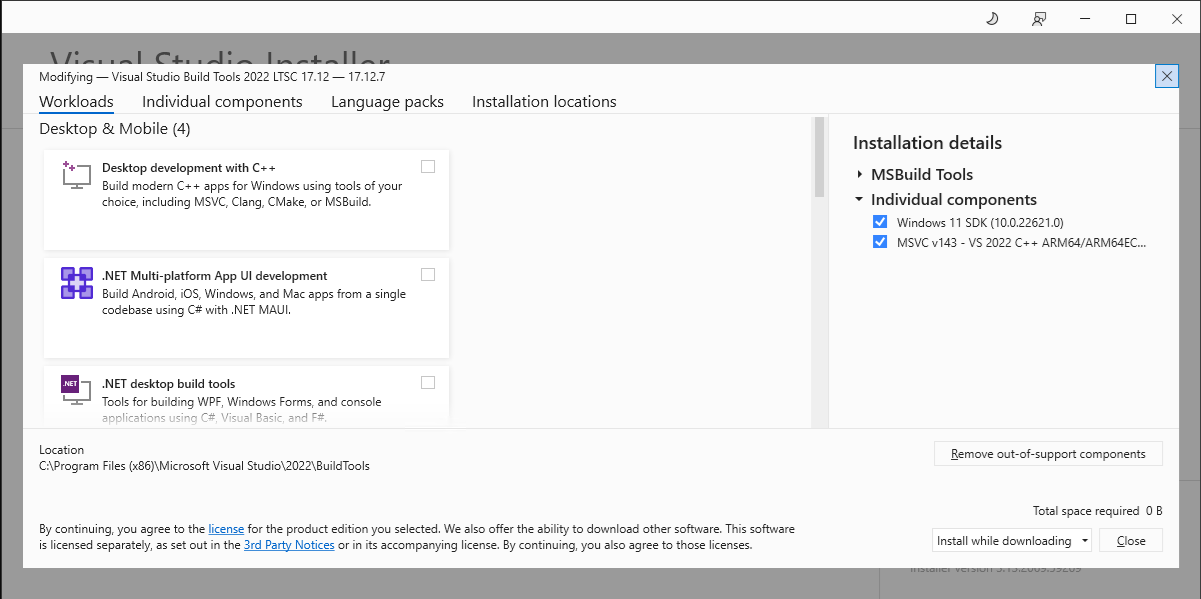
Changing the host architecture to arm64 did not help. I launched the VS installer and noticed that the “Desktop development with C++” workload was not installed so I must have been missing additional components.
Visual Studio Build Tools 2022 LTSC 17.12 Workloads
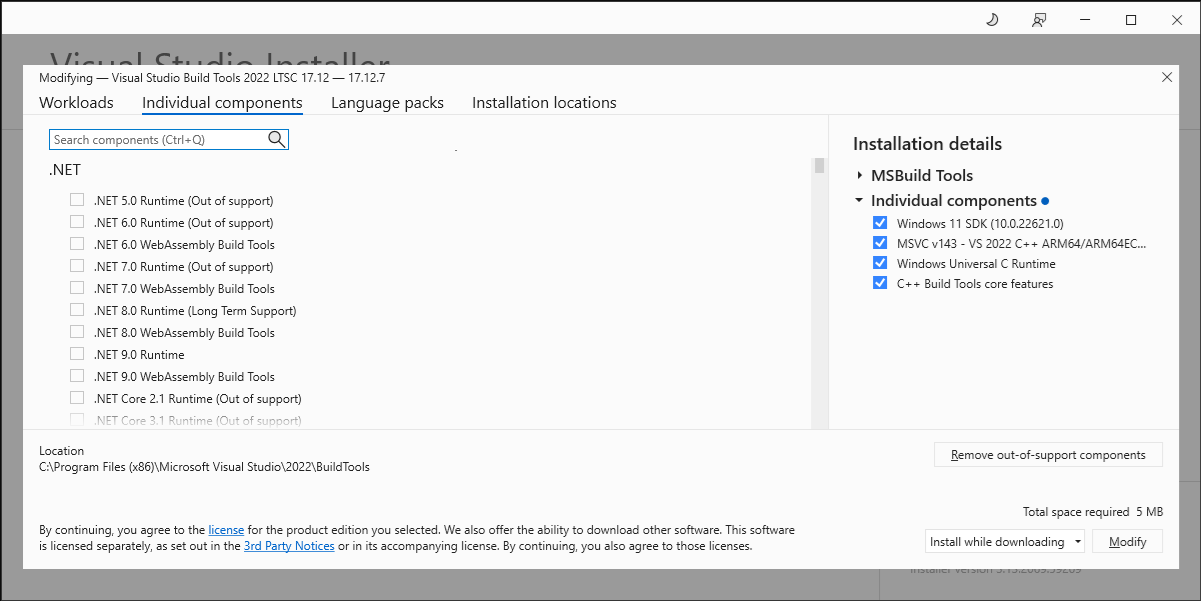
I didn’t want to install the whole workload though, just the necessary individual components. I noticed the C++ Build Tools core features component wasn’t installed so I selected it. The Windows Universal C Runtime component is automatically selected as well:
Visual Studio Build Tools 2022 LTSC 17.12 Individual Components
Once the installation completed, I could run cl.exe in the developer command prompt!
**********************************************************************
** Visual Studio 2022 Developer Command Prompt v17.12.7
** Copyright (c) 2022 Microsoft Corporation
**********************************************************************

C:\Program Files (x86)\Microsoft Visual Studio\2022\BuildTools>cl
Microsoft (R) C/C++ Optimizing Compiler Version 19.42.34441 for ARM64
Copyright (C) Microsoft Corporation.  All rights reserved.

usage: cl [ option... ] filename... [ /link linkoption... ]

C:\Program Files (x86)\Microsoft Visual Studio\2022\BuildTools>
The VS installer log in %TEMP% contained these components:
Copilot informed me that the caret was the way to split a command across multiple lines in the Windows Command Prompt. This was the final command I used to complete the 8353009: Improve documentation for Windows AArch64 builds PR.
I mentioned in my last post (Learning about Large Language Models) that I recently started going through Sebastian Raschka’s Build a Large Language Model from Scratch book. It had been a while since I ran python code on my laptop so I needed to do some cleanup to restore my environment. I cloned the repo and started executing the first cell in Chapter 2:
from importlib.metadata import version

print("torch version:", version("torch"))
print("tiktoken version:", version("tiktoken"))
I got this error: PackageNotFoundError: No package metadata was found for torch".
{
	"name": "PackageNotFoundError",
	"message": "No package metadata was found for torch",
	"stack": "---------------------------------------------------------------------------
StopIteration                             Traceback (most recent call last)
File /opt/homebrew/Cellar/python@3.11/3.11.1/Frameworks/Python.framework/Versions/3.11/lib/python3.11/importlib/metadata/__init__.py:563, in Distribution.from_name(cls, name)
    562 try:
--> 563     return next(cls.discover(name=name))
    564 except StopIteration:

StopIteration:

During handling of the above exception, another exception occurred:

PackageNotFoundError                      Traceback (most recent call last)
Cell In[2], line 7
      3 print(sys.version)
      5 from importlib.metadata import version
----> 7 print(\"torch version:\", version(\"torch\"))
      8 print(\"tiktoken version:\", version(\"tiktoken\"))

File /opt/homebrew/Cellar/python@3.11/3.11.1/Frameworks/Python.framework/Versions/3.11/lib/python3.11/importlib/metadata/__init__.py:1008, in version(distribution_name)
   1001 def version(distribution_name):
   1002     \"\"\"Get the version string for the named package.
   1003
   1004     :param distribution_name: The name of the distribution package to query.
   1005     :return: The version string for the package as defined in the package's
   1006         \"Version\" metadata key.
   1007     \"\"\"
-> 1008     return distribution(distribution_name).version

File /opt/homebrew/Cellar/python@3.11/3.11.1/Frameworks/Python.framework/Versions/3.11/lib/python3.11/importlib/metadata/__init__.py:981, in distribution(distribution_name)
    975 def distribution(distribution_name):
    976     \"\"\"Get the ``Distribution`` instance for the named package.
    977
    978     :param distribution_name: The name of the distribution package as a string.
    979     :return: A ``Distribution`` instance (or subclass thereof).
    980     \"\"\"
--> 981     return Distribution.from_name(distribution_name)

File /opt/homebrew/Cellar/python@3.11/3.11.1/Frameworks/Python.framework/Versions/3.11/lib/python3.11/importlib/metadata/__init__.py:565, in Distribution.from_name(cls, name)
    563     return next(cls.discover(name=name))
    564 except StopIteration:
--> 565     raise PackageNotFoundError(name)

PackageNotFoundError: No package metadata was found for torch"
}
How is this showing version 3.10.9 but VS Code is using 3.11 from brew (per the file paths in the error messages? This is how to print the version from a python script as per Printing Python version in output – Stack Overflow
Since I have brew installed, this might be what I need: the comment that “If you brew-install Python, but pip is still not in your path, you might need to re-link, like this brew unlink python && brew link python” at python – How do I install pip on macOS or OS X? – Stack Overflow.
saint@MacBookPro LLMs-from-scratch % brew update
==> Downloading https://ghcr.io/v2/homebrew/portable-ruby/portable-ruby/blobs/sha256:d9faa506c014dedc0b034a68103ba75c9a58242f4d6c67b6ca0f649c39602bcf
######################################################################################################################################################################################################################################### 100.0%
==> Pouring portable-ruby-3.3.7.arm64_big_sur.bottle.tar.gz
==> Homebrew collects anonymous analytics.
Read the analytics documentation (and how to opt-out) here:
  https://docs.brew.sh/Analytics
No analytics have been recorded yet (nor will be during this `brew` run).

==> homebrew/core is old and unneeded, untapping to save space...
Untapping homebrew/core...
Untapped 3 commands and 7398 formulae (7,130 files, 1GB).
==> homebrew/cask is old and unneeded, untapping to save space...
Untapping homebrew/cask...
Untapped 7333 casks (4,415 files, 487.2MB).
==> Downloading https://formulae.brew.sh/api/formula_tap_migrations.jws.json
Updated 4 taps (microsoft/git, homebrew/cask-versions, homebrew/core and homebrew/cask).
==> New Formulae

...<hundreds of lines omitted but included python entries below>

python-argcomplete
python-freethreading
python-gdbm@3.12
python-gdbm@3.13
python-matplotlib
python-packaging
python-setuptools
python-tk@3.12
python-tk@3.13
python@3.12
python@3.13
pyupgrade
...

==> Deleted Installed Formulae
icu4c ✘
==> Deleted Installed Casks
git-credential-manager-core ✘                                                                                            microsoft-openjdk11 ✘
Error: Unexpected method 'appcast' called on Cask adoptopenjdk16.
Follow the instructions here:
  https://github.com/Homebrew/homebrew-cask#reporting-bugs
==> Downloading https://formulae.brew.sh/api/cask_tap_migrations.jws.json
==> Outdated Formulae
aom                 fb303               fribidi             gnuplot             jasper              libheif             libtool             lua                 openblas            pstoedit            sqlite              xorgproto
arpack              fbthrift            gcc                 graphicsmagick      jbig2dec            libidn              libunistring        lz4                 openexr             pyqt@5              suite-sparse        xz
autoconf            fig2dev             gd                  harfbuzz            jpeg-turbo          libidn2             libvmaf             maven               openjdk             python@3.10         sundials            zstd
boost               fizz                gdbm                hdf5                jpeg-xl             liblqr              libx11              mpdecimal           openjpeg            python@3.11         tcl-tk
brotli              flac                gettext             highway             libaec              libomp              libxau              mpfr                openssl@1.1         python@3.9          texinfo
ca-certificates     fltk                ghostscript         hwloc               libavif             libpng              libxcb              mpg123              openssl@3           qscintilla2         wangle
cairo               fmt                 giflib              icu4c@76            libcerf             libraw              libxdmcp            netpbm              opus                qt@5                watchman
cmake               folly               git-gui             imagemagick         libde265            libsndfile          libxext             ninja               pango               readline            webp
double-conversion   fontconfig          glib                imath               libevent            libsodium           libxrender          octave              pcre2               shared-mime-info    wget
edencommon          freetype            gmp                 isl                 libffi              libtiff             little-cms2         open-mpi            pixman              snappy              x265
==> Outdated Casks
git-credential-manager                                                          microsoft-openjdk                                                               microsoft-openjdk@11

You have 113 outdated formulae and 3 outdated casks installed.
You can upgrade them with brew upgrade
or list them with brew outdated.
Error: Unexpected method 'appcast' called on Cask adoptopenjdk16.
Follow the instructions here:
  https://github.com/Homebrew/homebrew-cask#reporting-bugs
==> Migrating cask git-credential-manager-core to git-credential-manager
Error: inreplace failed
/opt/homebrew/Caskroom/git-credential-manager/.metadata/2.1.2/20230703191748.675/Casks/git-credential-manager.rb:
  expected replacement of /\A\s*cask\s+"git\-credential\-manager\-core"/ with "cask \"git-credential-manager\""
python3 --version is still 3.10.9 after this. I tried running pip but zsh sayd command not found. Unfortunately, linking or unlinking of either python or python3 fails with the errors below (despite ls -l `which python3` showing the same path as before).
saint@MacBookPro LLMs-from-scratch % brew unlink python3
Error: Unexpected method 'appcast' called on Cask adoptopenjdk16.
Follow the instructions here:
  https://github.com/Homebrew/homebrew-cask#reporting-bugs
Error: No such keg: /opt/homebrew/Cellar/python3
I decided to install python3 again.
saint@MacBookPro LLMs-from-scratch % brew install python3
==> Downloading https://formulae.brew.sh/api/formula.jws.json
==> Downloading https://formulae.brew.sh/api/cask.jws.json
==> Downloading https://ghcr.io/v2/homebrew/core/python/3.13/manifests/3.13.1
######################################################################################################################################################################################################################################### 100.0%
==> Fetching dependencies for python@3.13: mpdecimal, ca-certificates, openssl@3, readline, sqlite and xz
==> Downloading https://ghcr.io/v2/homebrew/core/mpdecimal/manifests/4.0.0-1
######################################################################################################################################################################################################################################### 100.0%
==> Fetching mpdecimal
==> Downloading https://ghcr.io/v2/homebrew/core/mpdecimal/blobs/sha256:0f5f269bed0e6be2de3edfc4b52867e656f993e5bcff40717f26ee94dd0d2211
######################################################################################################################################################################################################################################### 100.0%
==> Downloading https://ghcr.io/v2/homebrew/core/ca-certificates/manifests/2024-12-31
######################################################################################################################################################################################################################################### 100.0%
==> Fetching ca-certificates
...
<lots of omitted lines>
...
==> Fetching harfbuzz
==> Downloading https://ghcr.io/v2/homebrew/core/harfbuzz/blobs/sha256:2f892566c02b3c8c61aed6f7867b4405e5c814df8500ef4bc4ca91a9e40205a9
######################################################################################################################################################################################################################################### 100.0%
==> Fetching openjdk
==> Downloading https://ghcr.io/v2/homebrew/core/openjdk/blobs/sha256:1285eadf2b5998cda49e4470ee3875e855b0be199765401ad77dc38aea573f49
######################################################################################################################################################################################################################################### 100.0%
Error: can't modify frozen String: "The bottle needs the Xcode Command Line Tools to be installed at /Library/Developer/CommandLineTools.\nDevelopment tools provided by Xcode.app are not sufficient.\n\nYou can install the Xcode Command Line Tools, if desired, with:\n    xcode-select --install\n"
This was the new state of affairs is that command (failed):
saint@MacBookPro LLMs-from-scratch % python3 --version
Python 3.13.1
saint@MacBookPro LLMs-from-scratch % which python3
/opt/homebrew/bin/python3
saint@MacBookPro LLMs-from-scratch % ls -l `which python3`
lrwxr-xr-x  1 saint  admin  40 Feb  4 17:02 /opt/homebrew/bin/python3 -> ../Cellar/python@3.13/3.13.1/bin/python3
saint@MacBookPro LLMs-from-scratch % which pip
pip not found
Ah, all that agonizing and look at this – did I need to be using pip3 all this time?
saint@MacBookPro LLMs-from-scratch % which pip3
/opt/homebrew/bin/pip3
saint@MacBookPro LLMs-from-scratch % ls -l `which pip3`
lrwxr-xr-x  1 saint  admin  37 Feb  4 17:02 /opt/homebrew/bin/pip3 -> ../Cellar/python@3.13/3.13.1/bin/pip3
saint@MacBookPro LLMs-from-scratch %
Interestingly, I still can’t install pytorch using pip3?
saint@MacBookPro LLMs-from-scratch % pip3 install pytorch

[notice] A new release of pip is available: 24.3.1 -> 25.0
[notice] To update, run: python3.13 -m pip install --upgrade pip
error: externally-managed-environment

× This environment is externally managed
╰─> To install Python packages system-wide, try brew install
    xyz, where xyz is the package you are trying to
    install.

    If you wish to install a Python library that isn't in Homebrew,
    use a virtual environment:

    python3 -m venv path/to/venv
    source path/to/venv/bin/activate
    python3 -m pip install xyz

    If you wish to install a Python application that isn't in Homebrew,
    it may be easiest to use 'pipx install xyz', which will manage a
    virtual environment for you. You can install pipx with

    brew install pipx

    You may restore the old behavior of pip by passing
    the '--break-system-packages' flag to pip, or by adding
    'break-system-packages = true' to your pip.conf file. The latter
    will permanently disable this error.

    If you disable this error, we STRONGLY recommend that you additionally
    pass the '--user' flag to pip, or set 'user = true' in your pip.conf
    file. Failure to do this can result in a broken Homebrew installation.

    Read more about this behavior here: <https://peps.python.org/pep-0668/>

note: If you believe this is a mistake, please contact your Python installation or OS distribution provider. You can override this, at the risk of breaking your Python installation or OS, by passing --break-system-packages.
hint: See PEP 668 for the detailed specification.
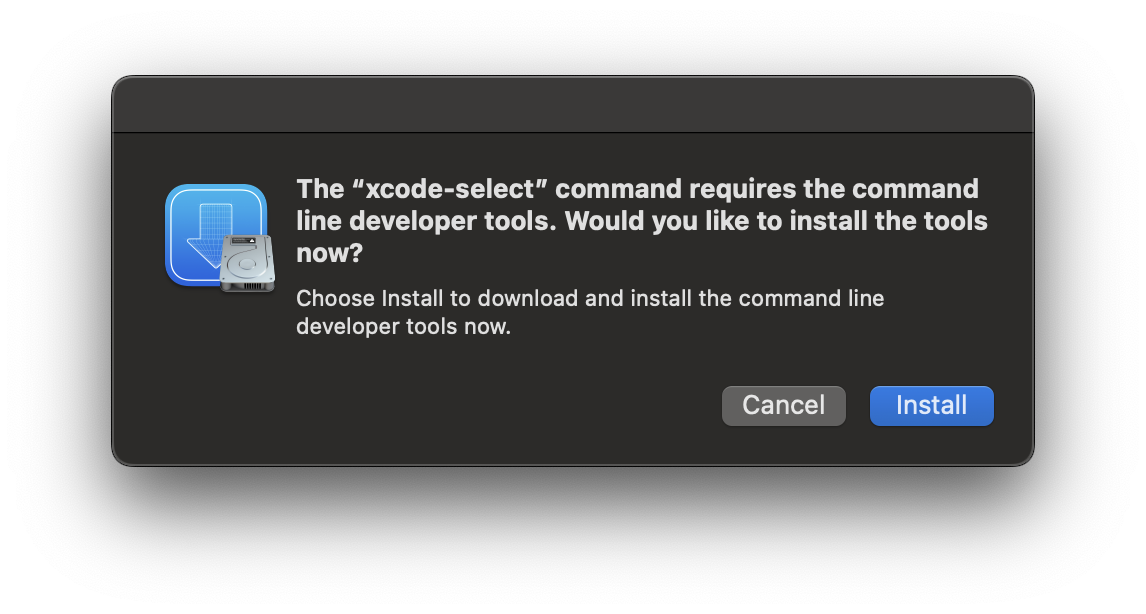
saint@MacBookPro LLMs-from-scratch % xcode-select --install
xcode-select: note: install requested for command line developer tools
I installed the command line developer tools when prompted below.
Trying to run the first cell in VS Code with the updated setup now gave this error:
{
	"name": "",
	"message": "",
	"stack": "Running cells with 'Python 3.13.1' requires the ipykernel package.
Run the following command to install 'ipykernel' into the Python environment.
Command: '/opt/homebrew/bin/python3 -m pip install ipykernel -U --user --force-reinstall'"
}
saint@MacBookPro LLMs-from-scratch % /opt/homebrew/bin/python3 -m pip install ipykernel -U --user --force-reinstall

[notice] A new release of pip is available: 24.3.1 -> 25.0
[notice] To update, run: python3.13 -m pip install --upgrade pip
error: externally-managed-environment

× This environment is externally managed
╰─> To install Python packages system-wide, try brew install
    xyz, where xyz is the package you are trying to
    install.

    If you wish to install a Python library that isn't in Homebrew,
    use a virtual environment:

    python3 -m venv path/to/venv
    source path/to/venv/bin/activate
    python3 -m pip install xyz

    If you wish to install a Python application that isn't in Homebrew,
    it may be easiest to use 'pipx install xyz', which will manage a
    virtual environment for you. You can install pipx with

    brew install pipx

    You may restore the old behavior of pip by passing
    the '--break-system-packages' flag to pip, or by adding
    'break-system-packages = true' to your pip.conf file. The latter
    will permanently disable this error.

    If you disable this error, we STRONGLY recommend that you additionally
    pass the '--user' flag to pip, or set 'user = true' in your pip.conf
    file. Failure to do this can result in a broken Homebrew installation.

    Read more about this behavior here: <https://peps.python.org/pep-0668/>

note: If you believe this is a mistake, please contact your Python installation or OS distribution provider. You can override this, at the risk of breaking your Python installation or OS, by passing --break-system-packages.
hint: See PEP 668 for the detailed specification.
saint@MacBookPro LLMs-from-scratch % brew install ipykernel
==> Downloading https://formulae.brew.sh/api/formula.jws.json
==> Downloading https://formulae.brew.sh/api/cask.jws.json
Warning: No available formula with the name "ipykernel".
==> Searching for similarly named formulae and casks...
Error: No formulae or casks found for ipykernel.
I override the warning using the --break-system-packages flag and the VS Code notebook now runs.
saint@MacBookPro LLMs-from-scratch % python3 -m pip install ipykernel -U --user --force-reinstall --break-system-package
Collecting ipykernel
  Downloading ipykernel-6.29.5-py3-none-any.whl.metadata (6.3 kB)
Collecting appnope (from ipykernel)
  Downloading appnope-0.1.4-py2.py3-none-any.whl.metadata (908 bytes)
Collecting comm>=0.1.1 (from ipykernel)
  Downloading comm-0.2.2-py3-none-any.whl.metadata (3.7 kB)
Collecting debugpy>=1.6.5 (from ipykernel)
  Downloading debugpy-1.8.12-cp313-cp313-macosx_14_0_universal2.whl.metadata (1.3 kB)
Collecting ipython>=7.23.1 (from ipykernel)
  Downloading ipython-8.32.0-py3-none-any.whl.metadata (5.0 kB)
Collecting jupyter-client>=6.1.12 (from ipykernel)
  Downloading jupyter_client-8.6.3-py3-none-any.whl.metadata (8.3 kB)
Collecting jupyter-core!=5.0.*,>=4.12 (from ipykernel)
  Downloading jupyter_core-5.7.2-py3-none-any.whl.metadata (3.4 kB)
Collecting matplotlib-inline>=0.1 (from ipykernel)
  Downloading matplotlib_inline-0.1.7-py3-none-any.whl.metadata (3.9 kB)
Collecting nest-asyncio (from ipykernel)
  Downloading nest_asyncio-1.6.0-py3-none-any.whl.metadata (2.8 kB)
Collecting packaging (from ipykernel)
  Downloading packaging-24.2-py3-none-any.whl.metadata (3.2 kB)
Collecting psutil (from ipykernel)
  Downloading psutil-6.1.1-cp36-abi3-macosx_11_0_arm64.whl.metadata (22 kB)
Collecting pyzmq>=24 (from ipykernel)
  Downloading pyzmq-26.2.1-cp313-cp313-macosx_10_15_universal2.whl.metadata (6.2 kB)
Collecting tornado>=6.1 (from ipykernel)
  Downloading tornado-6.4.2-cp38-abi3-macosx_10_9_universal2.whl.metadata (2.5 kB)
Collecting traitlets>=5.4.0 (from ipykernel)
  Downloading traitlets-5.14.3-py3-none-any.whl.metadata (10 kB)
Collecting decorator (from ipython>=7.23.1->ipykernel)
  Downloading decorator-5.1.1-py3-none-any.whl.metadata (4.0 kB)
Collecting jedi>=0.16 (from ipython>=7.23.1->ipykernel)
  Downloading jedi-0.19.2-py2.py3-none-any.whl.metadata (22 kB)
Collecting pexpect>4.3 (from ipython>=7.23.1->ipykernel)
  Downloading pexpect-4.9.0-py2.py3-none-any.whl.metadata (2.5 kB)
Collecting prompt_toolkit<3.1.0,>=3.0.41 (from ipython>=7.23.1->ipykernel)
  Downloading prompt_toolkit-3.0.50-py3-none-any.whl.metadata (6.6 kB)
Collecting pygments>=2.4.0 (from ipython>=7.23.1->ipykernel)
  Downloading pygments-2.19.1-py3-none-any.whl.metadata (2.5 kB)
Collecting stack_data (from ipython>=7.23.1->ipykernel)
  Downloading stack_data-0.6.3-py3-none-any.whl.metadata (18 kB)
Collecting python-dateutil>=2.8.2 (from jupyter-client>=6.1.12->ipykernel)
  Downloading python_dateutil-2.9.0.post0-py2.py3-none-any.whl.metadata (8.4 kB)
Collecting platformdirs>=2.5 (from jupyter-core!=5.0.*,>=4.12->ipykernel)
  Downloading platformdirs-4.3.6-py3-none-any.whl.metadata (11 kB)
Collecting parso<0.9.0,>=0.8.4 (from jedi>=0.16->ipython>=7.23.1->ipykernel)
  Downloading parso-0.8.4-py2.py3-none-any.whl.metadata (7.7 kB)
Collecting ptyprocess>=0.5 (from pexpect>4.3->ipython>=7.23.1->ipykernel)
  Downloading ptyprocess-0.7.0-py2.py3-none-any.whl.metadata (1.3 kB)
Collecting wcwidth (from prompt_toolkit<3.1.0,>=3.0.41->ipython>=7.23.1->ipykernel)
  Downloading wcwidth-0.2.13-py2.py3-none-any.whl.metadata (14 kB)
Collecting six>=1.5 (from python-dateutil>=2.8.2->jupyter-client>=6.1.12->ipykernel)
  Downloading six-1.17.0-py2.py3-none-any.whl.metadata (1.7 kB)
Collecting executing>=1.2.0 (from stack_data->ipython>=7.23.1->ipykernel)
  Downloading executing-2.2.0-py2.py3-none-any.whl.metadata (8.9 kB)
Collecting asttokens>=2.1.0 (from stack_data->ipython>=7.23.1->ipykernel)
  Downloading asttokens-3.0.0-py3-none-any.whl.metadata (4.7 kB)
Collecting pure-eval (from stack_data->ipython>=7.23.1->ipykernel)
  Downloading pure_eval-0.2.3-py3-none-any.whl.metadata (6.3 kB)
Downloading ipykernel-6.29.5-py3-none-any.whl (117 kB)
Downloading comm-0.2.2-py3-none-any.whl (7.2 kB)
Downloading debugpy-1.8.12-cp313-cp313-macosx_14_0_universal2.whl (2.5 MB)
   ━━━━━━━━━━━━━━━━━━━━━━━━━━━━━━━━━━━━━━━━ 2.5/2.5 MB 36.8 MB/s eta 0:00:00
Downloading ipython-8.32.0-py3-none-any.whl (825 kB)
   ━━━━━━━━━━━━━━━━━━━━━━━━━━━━━━━━━━━━━━━━ 825.5/825.5 kB 54.9 MB/s eta 0:00:00
Downloading jupyter_client-8.6.3-py3-none-any.whl (106 kB)
Downloading jupyter_core-5.7.2-py3-none-any.whl (28 kB)
Downloading matplotlib_inline-0.1.7-py3-none-any.whl (9.9 kB)
Downloading pyzmq-26.2.1-cp313-cp313-macosx_10_15_universal2.whl (1.3 MB)
   ━━━━━━━━━━━━━━━━━━━━━━━━━━━━━━━━━━━━━━━━ 1.3/1.3 MB 62.7 MB/s eta 0:00:00
Downloading tornado-6.4.2-cp38-abi3-macosx_10_9_universal2.whl (436 kB)
Downloading traitlets-5.14.3-py3-none-any.whl (85 kB)
Downloading appnope-0.1.4-py2.py3-none-any.whl (4.3 kB)
Downloading nest_asyncio-1.6.0-py3-none-any.whl (5.2 kB)
Downloading packaging-24.2-py3-none-any.whl (65 kB)
Downloading psutil-6.1.1-cp36-abi3-macosx_11_0_arm64.whl (248 kB)
Downloading jedi-0.19.2-py2.py3-none-any.whl (1.6 MB)
   ━━━━━━━━━━━━━━━━━━━━━━━━━━━━━━━━━━━━━━━━ 1.6/1.6 MB 79.1 MB/s eta 0:00:00
Downloading pexpect-4.9.0-py2.py3-none-any.whl (63 kB)
Downloading platformdirs-4.3.6-py3-none-any.whl (18 kB)
Downloading prompt_toolkit-3.0.50-py3-none-any.whl (387 kB)
Downloading pygments-2.19.1-py3-none-any.whl (1.2 MB)
   ━━━━━━━━━━━━━━━━━━━━━━━━━━━━━━━━━━━━━━━━ 1.2/1.2 MB 58.1 MB/s eta 0:00:00
Downloading python_dateutil-2.9.0.post0-py2.py3-none-any.whl (229 kB)
Downloading decorator-5.1.1-py3-none-any.whl (9.1 kB)
Downloading stack_data-0.6.3-py3-none-any.whl (24 kB)
Downloading asttokens-3.0.0-py3-none-any.whl (26 kB)
Downloading executing-2.2.0-py2.py3-none-any.whl (26 kB)
Downloading parso-0.8.4-py2.py3-none-any.whl (103 kB)
Downloading ptyprocess-0.7.0-py2.py3-none-any.whl (13 kB)
Downloading six-1.17.0-py2.py3-none-any.whl (11 kB)
Downloading pure_eval-0.2.3-py3-none-any.whl (11 kB)
Downloading wcwidth-0.2.13-py2.py3-none-any.whl (34 kB)
Installing collected packages: wcwidth, pure-eval, ptyprocess, traitlets, tornado, six, pyzmq, pygments, psutil, prompt_toolkit, platformdirs, pexpect, parso, packaging, nest-asyncio, executing, decorator, debugpy, asttokens, appnope, stack_data, python-dateutil, matplotlib-inline, jupyter-core, jedi, comm, jupyter-client, ipython, ipykernel
  WARNING: The script pygmentize is installed in '/Users/saint/Library/Python/3.13/bin' which is not on PATH.
  Consider adding this directory to PATH or, if you prefer to suppress this warning, use --no-warn-script-location.
  WARNING: The script debugpy is installed in '/Users/saint/Library/Python/3.13/bin' which is not on PATH.
  Consider adding this directory to PATH or, if you prefer to suppress this warning, use --no-warn-script-location.
  WARNING: The scripts jupyter, jupyter-migrate and jupyter-troubleshoot are installed in '/Users/saint/Library/Python/3.13/bin' which is not on PATH.
  Consider adding this directory to PATH or, if you prefer to suppress this warning, use --no-warn-script-location.
  WARNING: The scripts jupyter-kernel, jupyter-kernelspec and jupyter-run are installed in '/Users/saint/Library/Python/3.13/bin' which is not on PATH.
  Consider adding this directory to PATH or, if you prefer to suppress this warning, use --no-warn-script-location.
  WARNING: The scripts ipython and ipython3 are installed in '/Users/saint/Library/Python/3.13/bin' which is not on PATH.
  Consider adding this directory to PATH or, if you prefer to suppress this warning, use --no-warn-script-location.
Successfully installed appnope-0.1.4 asttokens-3.0.0 comm-0.2.2 debugpy-1.8.12 decorator-5.1.1 executing-2.2.0 ipykernel-6.29.5 ipython-8.32.0 jedi-0.19.2 jupyter-client-8.6.3 jupyter-core-5.7.2 matplotlib-inline-0.1.7 nest-asyncio-1.6.0 packaging-24.2 parso-0.8.4 pexpect-4.9.0 platformdirs-4.3.6 prompt_toolkit-3.0.50 psutil-6.1.1 ptyprocess-0.7.0 pure-eval-0.2.3 pygments-2.19.1 python-dateutil-2.9.0.post0 pyzmq-26.2.1 six-1.17.0 stack_data-0.6.3 tornado-6.4.2 traitlets-5.14.3 wcwidth-0.2.13

[notice] A new release of pip is available: 24.3.1 -> 25.0
[notice] To update, run: python3.13 -m pip install --upgrade pip
saint@MacBookPro LLMs-from-scratch %
First cell now fails because the torch package cannot be found:
{
	"name": "PackageNotFoundError",
	"message": "No package metadata was found for torch",
	"stack": "---------------------------------------------------------------------------
StopIteration                             Traceback (most recent call last)
File /opt/homebrew/Cellar/python@3.13/3.13.1/Frameworks/Python.framework/Versions/3.13/lib/python3.13/importlib/metadata/__init__.py:407, in Distribution.from_name(cls, name)
    406 try:
--> 407     return next(iter(cls.discover(name=name)))
    408 except StopIteration:

StopIteration:

During handling of the above exception, another exception occurred:

PackageNotFoundError                      Traceback (most recent call last)
Cell In[1], line 3
      1 from importlib.metadata import version
----> 3 print(\"torch version:\", version(\"torch\"))
      4 print(\"tiktoken version:\", version(\"tiktoken\"))

File /opt/homebrew/Cellar/python@3.13/3.13.1/Frameworks/Python.framework/Versions/3.13/lib/python3.13/importlib/metadata/__init__.py:987, in version(distribution_name)
    980 def version(distribution_name: str) -> str:
    981     \"\"\"Get the version string for the named package.
    982
    983     :param distribution_name: The name of the distribution package to query.
    984     :return: The version string for the package as defined in the package's
    985         \"Version\" metadata key.
    986     \"\"\"
--> 987     return distribution(distribution_name).version

File /opt/homebrew/Cellar/python@3.13/3.13.1/Frameworks/Python.framework/Versions/3.13/lib/python3.13/importlib/metadata/__init__.py:960, in distribution(distribution_name)
    954 def distribution(distribution_name: str) -> Distribution:
    955     \"\"\"Get the ``Distribution`` instance for the named package.
    956
    957     :param distribution_name: The name of the distribution package as a string.
    958     :return: A ``Distribution`` instance (or subclass thereof).
    959     \"\"\"
--> 960     return Distribution.from_name(distribution_name)

File /opt/homebrew/Cellar/python@3.13/3.13.1/Frameworks/Python.framework/Versions/3.13/lib/python3.13/importlib/metadata/__init__.py:409, in Distribution.from_name(cls, name)
    407     return next(iter(cls.discover(name=name)))
    408 except StopIteration:
--> 409     raise PackageNotFoundError(name)

PackageNotFoundError: No package metadata was found for torch"
}
These are the commands I tried to install pytorch before finding the correct one: pip3 install torch --break-system-packages.
saint@MacBookPro LLMs-from-scratch % brew install torch
==> Downloading https://formulae.brew.sh/api/formula.jws.json
==> Downloading https://formulae.brew.sh/api/cask.jws.json
Warning: No available formula with the name "torch". Did you mean tor, pytorch or orc?
==> Searching for similarly named formulae and casks...
==> Formulae
pytorch ✔                                                    torchvision                                                  tor                                                          orc

To install pytorch ✔, run:
  brew install pytorch ✔
saint@MacBookPro LLMs-from-scratch % brew install pytorch
Warning: pytorch 2.5.1_4 is already installed and up-to-date.
To reinstall 2.5.1_4, run:
  brew reinstall pytorch
saint@MacBookPro LLMs-from-scratch % pip3 install torch

[notice] A new release of pip is available: 24.3.1 -> 25.0
[notice] To update, run: python3.13 -m pip install --upgrade pip
error: externally-managed-environment

× This environment is externally managed
╰─> To install Python packages system-wide, try brew install
    xyz, where xyz is the package you are trying to
    install.

    If you wish to install a Python library that isn't in Homebrew,
    use a virtual environment:

    python3 -m venv path/to/venv
    source path/to/venv/bin/activate
    python3 -m pip install xyz

    If you wish to install a Python application that isn't in Homebrew,
    it may be easiest to use 'pipx install xyz', which will manage a
    virtual environment for you. You can install pipx with

    brew install pipx

    You may restore the old behavior of pip by passing
    the '--break-system-packages' flag to pip, or by adding
    'break-system-packages = true' to your pip.conf file. The latter
    will permanently disable this error.

    If you disable this error, we STRONGLY recommend that you additionally
    pass the '--user' flag to pip, or set 'user = true' in your pip.conf
    file. Failure to do this can result in a broken Homebrew installation.

    Read more about this behavior here: <https://peps.python.org/pep-0668/>

note: If you believe this is a mistake, please contact your Python installation or OS distribution provider. You can override this, at the risk of breaking your Python installation or OS, by passing --break-system-packages.
hint: See PEP 668 for the detailed specification.
saint@MacBookPro LLMs-from-scratch %
saint@MacBookPro LLMs-from-scratch % pip3 install torch --break-system-packages
Collecting torch
  Downloading torch-2.6.0-cp313-none-macosx_11_0_arm64.whl.metadata (28 kB)
Collecting filelock (from torch)
  Downloading filelock-3.17.0-py3-none-any.whl.metadata (2.9 kB)
Collecting typing-extensions>=4.10.0 (from torch)
  Downloading typing_extensions-4.12.2-py3-none-any.whl.metadata (3.0 kB)
Collecting networkx (from torch)
  Downloading networkx-3.4.2-py3-none-any.whl.metadata (6.3 kB)
Collecting jinja2 (from torch)
  Downloading jinja2-3.1.5-py3-none-any.whl.metadata (2.6 kB)
Collecting fsspec (from torch)
  Downloading fsspec-2025.2.0-py3-none-any.whl.metadata (11 kB)
Collecting setuptools (from torch)
  Downloading setuptools-75.8.0-py3-none-any.whl.metadata (6.7 kB)
Collecting sympy==1.13.1 (from torch)
  Downloading sympy-1.13.1-py3-none-any.whl.metadata (12 kB)
Collecting mpmath<1.4,>=1.1.0 (from sympy==1.13.1->torch)
  Downloading mpmath-1.3.0-py3-none-any.whl.metadata (8.6 kB)
Collecting MarkupSafe>=2.0 (from jinja2->torch)
  Downloading MarkupSafe-3.0.2-cp313-cp313-macosx_11_0_arm64.whl.metadata (4.0 kB)
Downloading torch-2.6.0-cp313-none-macosx_11_0_arm64.whl (66.5 MB)
   ━━━━━━━━━━━━━━━━━━━━━━━━━━━━━━━━━━━━━━━━ 66.5/66.5 MB 74.3 MB/s eta 0:00:00
Downloading sympy-1.13.1-py3-none-any.whl (6.2 MB)
   ━━━━━━━━━━━━━━━━━━━━━━━━━━━━━━━━━━━━━━━━ 6.2/6.2 MB 75.0 MB/s eta 0:00:00
Downloading typing_extensions-4.12.2-py3-none-any.whl (37 kB)
Downloading filelock-3.17.0-py3-none-any.whl (16 kB)
Downloading fsspec-2025.2.0-py3-none-any.whl (184 kB)
Downloading jinja2-3.1.5-py3-none-any.whl (134 kB)
Downloading networkx-3.4.2-py3-none-any.whl (1.7 MB)
   ━━━━━━━━━━━━━━━━━━━━━━━━━━━━━━━━━━━━━━━━ 1.7/1.7 MB 63.7 MB/s eta 0:00:00
Downloading setuptools-75.8.0-py3-none-any.whl (1.2 MB)
   ━━━━━━━━━━━━━━━━━━━━━━━━━━━━━━━━━━━━━━━━ 1.2/1.2 MB 37.0 MB/s eta 0:00:00
Downloading MarkupSafe-3.0.2-cp313-cp313-macosx_11_0_arm64.whl (12 kB)
Downloading mpmath-1.3.0-py3-none-any.whl (536 kB)
   ━━━━━━━━━━━━━━━━━━━━━━━━━━━━━━━━━━━━━━━━ 536.2/536.2 kB 27.9 MB/s eta 0:00:00
Installing collected packages: mpmath, typing-extensions, sympy, setuptools, networkx, MarkupSafe, fsspec, filelock, jinja2, torch
Successfully installed MarkupSafe-3.0.2 filelock-3.17.0 fsspec-2025.2.0 jinja2-3.1.5 mpmath-1.3.0 networkx-3.4.2 setuptools-75.8.0 sympy-1.13.1 torch-2.6.0 typing-extensions-4.12.2

[notice] A new release of pip is available: 24.3.1 -> 25.0
[notice] To update, run: python3.13 -m pip install --upgrade pip
saint@MacBookPro LLMs-from-scratch %
The pytorch import finally works! The next error is also a PackageNotFoundError: "No package metadata was found for tiktoken" which I addressed with the same installation steps:
saint@MacBookPro LLMs-from-scratch % pip3 install tiktoken

[notice] A new release of pip is available: 24.3.1 -> 25.0
[notice] To update, run: python3.13 -m pip install --upgrade pip
error: externally-managed-environment

× This environment is externally managed
╰─> To install Python packages system-wide, try brew install
    xyz, where xyz is the package you are trying to
    install.

    If you wish to install a Python library that isn't in Homebrew,
    use a virtual environment:

    python3 -m venv path/to/venv
    source path/to/venv/bin/activate
    python3 -m pip install xyz

    If you wish to install a Python application that isn't in Homebrew,
    it may be easiest to use 'pipx install xyz', which will manage a
    virtual environment for you. You can install pipx with

    brew install pipx

    You may restore the old behavior of pip by passing
    the '--break-system-packages' flag to pip, or by adding
    'break-system-packages = true' to your pip.conf file. The latter
    will permanently disable this error.

    If you disable this error, we STRONGLY recommend that you additionally
    pass the '--user' flag to pip, or set 'user = true' in your pip.conf
    file. Failure to do this can result in a broken Homebrew installation.

    Read more about this behavior here: <https://peps.python.org/pep-0668/>

note: If you believe this is a mistake, please contact your Python installation or OS distribution provider. You can override this, at the risk of breaking your Python installation or OS, by passing --break-system-packages.
hint: See PEP 668 for the detailed specification.
saint@MacBookPro LLMs-from-scratch %
saint@MacBookPro LLMs-from-scratch % pip3 install tiktoken --break-system-packages
Collecting tiktoken
  Downloading tiktoken-0.8.0-cp313-cp313-macosx_11_0_arm64.whl.metadata (6.6 kB)
Collecting regex>=2022.1.18 (from tiktoken)
  Downloading regex-2024.11.6-cp313-cp313-macosx_11_0_arm64.whl.metadata (40 kB)
Collecting requests>=2.26.0 (from tiktoken)
  Downloading requests-2.32.3-py3-none-any.whl.metadata (4.6 kB)
Collecting charset-normalizer<4,>=2 (from requests>=2.26.0->tiktoken)
  Downloading charset_normalizer-3.4.1-cp313-cp313-macosx_10_13_universal2.whl.metadata (35 kB)
Collecting idna<4,>=2.5 (from requests>=2.26.0->tiktoken)
  Downloading idna-3.10-py3-none-any.whl.metadata (10 kB)
Collecting urllib3<3,>=1.21.1 (from requests>=2.26.0->tiktoken)
  Downloading urllib3-2.3.0-py3-none-any.whl.metadata (6.5 kB)
Collecting certifi>=2017.4.17 (from requests>=2.26.0->tiktoken)
  Downloading certifi-2025.1.31-py3-none-any.whl.metadata (2.5 kB)
Downloading tiktoken-0.8.0-cp313-cp313-macosx_11_0_arm64.whl (982 kB)
   ━━━━━━━━━━━━━━━━━━━━━━━━━━━━━━━━━━━━━━━━ 982.8/982.8 kB 24.2 MB/s eta 0:00:00
Downloading regex-2024.11.6-cp313-cp313-macosx_11_0_arm64.whl (284 kB)
Downloading requests-2.32.3-py3-none-any.whl (64 kB)
Downloading certifi-2025.1.31-py3-none-any.whl (166 kB)
Downloading charset_normalizer-3.4.1-cp313-cp313-macosx_10_13_universal2.whl (195 kB)
Downloading idna-3.10-py3-none-any.whl (70 kB)
Downloading urllib3-2.3.0-py3-none-any.whl (128 kB)
Installing collected packages: urllib3, regex, idna, charset-normalizer, certifi, requests, tiktoken
Successfully installed certifi-2025.1.31 charset-normalizer-3.4.1 idna-3.10 regex-2024.11.6 requests-2.32.3 tiktoken-0.8.0 urllib3-2.3.0

[notice] A new release of pip is available: 24.3.1 -> 25.0
[notice] To update, run: python3.13 -m pip install --upgrade pip
saint@MacBookPro LLMs-from-scratch %
Finally, my machine is in a state that can run the code in the Jupyter notebook! This is such a brittle environment. I need to switch to a managed environment to avoid this type of mess.
I want to evaluate the OpenJDK serial collector using a Java program I wrote to factorize natural numbers by trial division. This post is about how to set up the app to run in a Docker container on a Linux host. Since the host is a shared machine, I put all my work under ~/swesonga (my own custom home directory). The directory structure for the container will be under ~/swesonga/container/.
Set up the Factorization App
First, log into Linux machine and download the Java binaries to test:
ssh user@IPaddress
mkdir -p ~/swesonga/container/java/binaries/jdk/x64/
cd ~/swesonga/container/java/binaries/jdk/x64/

curl -Lo microsoft-jdk-21.0.5-linux-x64.tar.gz https://aka.ms/download-jdk/microsoft-jdk-21.0.5-linux-x64.tar.gz

tar xzf microsoft-jdk-21.0.5-linux-x64.tar.gz
cd ~/swesonga/container/
git clone https://github.com/swesonga/factorize

cd ~/swesonga/container/java
curl -Lo commons-cli-1.9.0-bin.tar.gz https://dlcdn.apache.org//commons/cli/binaries/commons-cli-1.9.0-bin.tar.gz
tar xzf commons-cli-1.9.0-bin.tar.gz
Verify that docker is up by running docker version. I got this output:
user@machine:~/swesonga$ docker version
Client: Docker Engine - Community
 Version:           23.0.1
 API version:       1.42
 Go version:        go1.19.5
 Git commit:        a5ee5b1
 Built:             Thu Feb  9 19:46:56 2023
 OS/Arch:           linux/amd64
 Context:           default
Cannot connect to the Docker daemon at unix:///var/run/docker.sock. Is the docker daemon running?
One error I ran into initially was that docker was unable to start the container process. I had missed the COPY command in the Dockerfile so the file couldn’t be found:
user@machine:~/swesonga$ docker run -i -t swesonga-jdk21-testapp
docker: Error response from daemon: failed to create shim task: OCI runtime create failed: runc create failed: unable to start container process: exec: "/home/<user>/swesonga/java/binaries/jdk/x64/jdk-21.0.5+11/bin/java": stat /home/<user>/swesonga/java/binaries/jdk/x64/jdk-21.0.5+11/bin/java: no such file or directory: unknown.
ERRO[0000] error waiting for container:
user@machine:~/swesonga$ docker system df
TYPE            TOTAL     ACTIVE    SIZE      RECLAIMABLE
Images          2         2         1.22GB    443.1MB (36%)
Containers      3         0         0B        0B
Local Volumes   0         0         0B        0B
Build Cache     9         0         776.9MB   776.9MB
user@machine:~/swesonga$ docker system df -v
Images space usage:

REPOSITORY               TAG       IMAGE ID       CREATED          SIZE      SHARED SIZE   UNIQUE SIZE   CONTAINERS
swesonga-jdk21-testapp   latest    682fedf54071   11 minutes ago   1.22GB    443.1MB       776.9MB       2
<none>                   <none>    4c068055cad5   26 minutes ago   443.1MB   443.1MB       0B            1

Containers space usage:

CONTAINER ID   IMAGE                    COMMAND                  LOCAL VOLUMES   SIZE      CREATED          STATUS    NAMES
c77b69082a8a   swesonga-jdk21-testapp   "/home/<user>/swesonga/…"   0               0B        6 minutes ago    Created   awesome_chatelet
58c723638dd2   swesonga-jdk21-testapp   "/home/<user>/swesonga/…"   0               0B        8 minutes ago    Created   sharp_lamport
4a3be55725b5   4c068055cad5             "/home/<user>/swesonga/…"   0               0B        17 minutes ago   Created   lucid_tharp

Local Volumes space usage:

VOLUME NAME   LINKS     SIZE

Build cache usage: 776.9MB
...
I tried pruning the build cache as suggested in that post.
user@machine:~/swesonga$ docker builder prune --all
WARNING! This will remove all build cache. Are you sure you want to continue? [y/N] y
ID                                              RECLAIMABLE     SIZE            LAST ACCESSED
te4o8rbj7s6nh6pluquzummzz                       true            0B              8 minutes ago
n2wbz4gf448fluw4uuogiqxdo*                      true    776.9MB         8 minutes ago
...
Total:  1.554GB
I realized that pruning wasn’t what I needed because now the cache was empty but the containers were still there based on the next output:
user@machine:~/swesonga$ docker system df -v
Images space usage:

REPOSITORY               TAG       IMAGE ID       CREATED          SIZE      SHARED SIZE   UNIQUE SIZE   CONTAINERS
swesonga-jdk21-testapp   latest    682fedf54071   18 minutes ago   1.22GB    443.1MB       776.9MB       2
<none>                   <none>    4c068055cad5   33 minutes ago   443.1MB   443.1MB       0B            1

Containers space usage:

CONTAINER ID   IMAGE                    COMMAND                  LOCAL VOLUMES   SIZE      CREATED          STATUS    NAMES
c77b69082a8a   swesonga-jdk21-testapp   "/home/<user>/swesonga/…"   0               0B        13 minutes ago   Created   awesome_chatelet
58c723638dd2   swesonga-jdk21-testapp   "/home/<user>/swesonga/…"   0               0B        15 minutes ago   Created   sharp_lamport
4a3be55725b5   4c068055cad5             "/home/<user>/swesonga/…"   0               0B        24 minutes ago   Created   lucid_tharp

Local Volumes space usage:

VOLUME NAME   LINKS     SIZE

Build cache usage: 0B

CACHE ID   CACHE TYPE   SIZE      CREATED   LAST USED   USAGE     SHARED
user@machine:~/swesonga$
I should have been using docker ps -a instead! The -a shows the existing containers (regardless of whether they are running).
user@machine:~/swesonga$ docker ps -a
CONTAINER ID   IMAGE          COMMAND                  CREATED          STATUS    PORTS     NAMES
c77b69082a8a   682fedf54071   "/home/<user>/swesonga/…"   16 minutes ago   Created             awesome_chatelet
58c723638dd2   682fedf54071   "/home/<user>/swesonga/…"   18 minutes ago   Created             sharp_lamport
4a3be55725b5   4c068055cad5   "/home/<user>/swesonga/…"   27 minutes ago   Created             lucid_tharp
user@machine:~/swesonga$
I started displaying the Dockerfile before building and one of the errors I ran into was because I hadn’t saved the Dockerfile. Sheesh.
cat Dockerfile
docker build -t swesonga-jdk21-testapp .
docker ps -a
docker run -i -t swesonga-jdk21-testapp
docker ps -a
docker run -i --memory 2GB -t swesonga-jdk21-testapp
Observe the head of the jdk21 GC log below. The total memory is now reported as 2048M. The maximum heap size is 25% of this total, as expected. The initial heap is 32MB and the minimum heap is 8MB.
The test passed on x64 but I wanted to see how to step into the test code itself so I tried this setup in Visual Studio 2022. Unfortunately, it was not straightforward to break into the correct process when launching the test in Visual Studio 2022.
I decided to try to understand the test execution sequence and started by looking at the output generated when running the jtreg test. Notice that the CreateCoredumpOnCrash product flag is disabled. The first thing I did was to enable it so that there is a core dump to examine.
The core dump wasn’t particularly helpful. I worked on simplifying the test so that only the failing scenarios remained. The log in the JBS issue was interpreted code only so I added the -Xint argument and could still reproduce the failure on Windows AArch64.
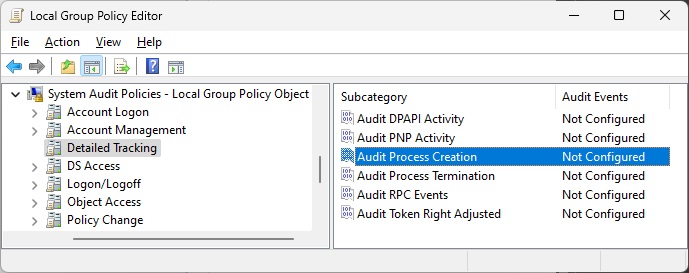
I came back to the idea of capturing the full command line for the final java.exe process that runs the test. Is there a way to log process start on Windows to capture all command lines? Copilot cited PowerShell and Command Line Logging | LogRhythm, which suggested enabling the use of Event ID 4688: a new process has been created.
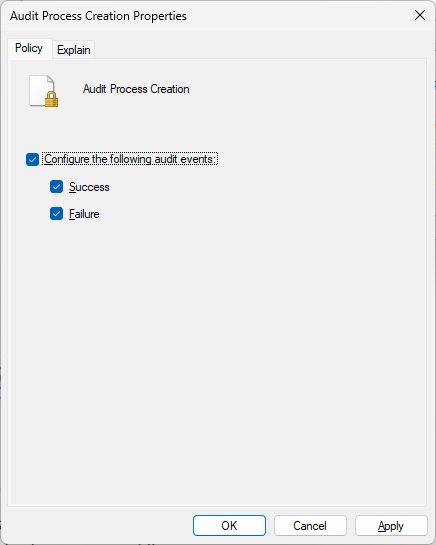
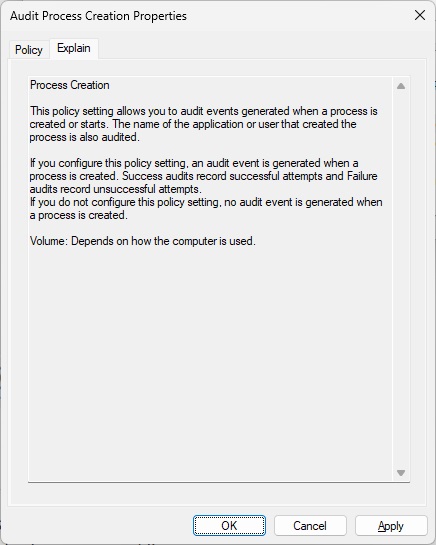
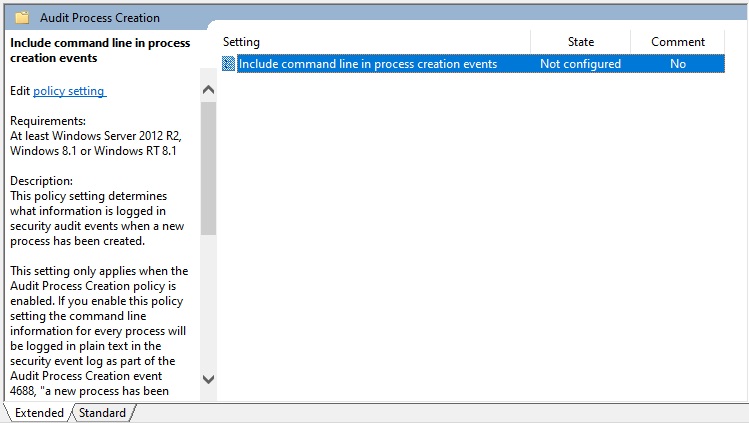
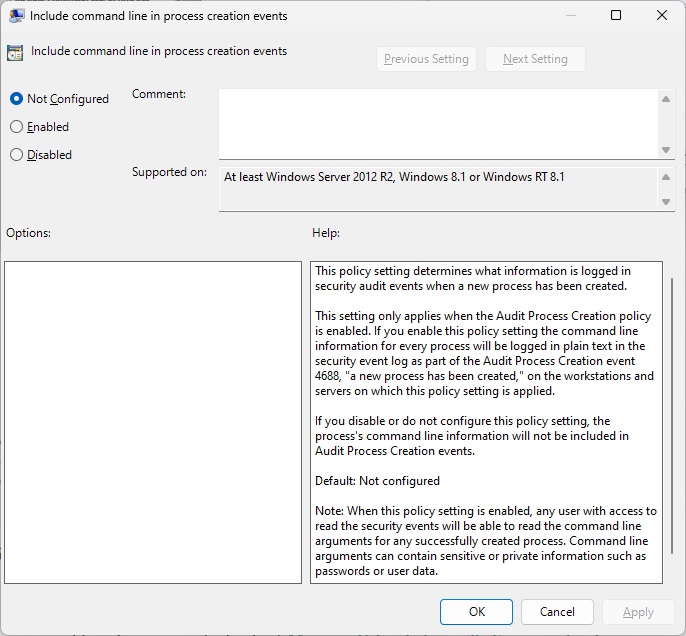
However, the event viewer didn’t have command line arguments when I did this, which is what I needed. I just looked up Event ID 4688 and found 4688(S) A new process has been created. – Windows 10 | Microsoft Learn, which explains that you must enable “Administrative Templates\System\Audit Process Creation\Include command line in process creation events” group policy to include command line in process creation events. Hmm, I definitely didn’t do that when I was investigating this issue. I just tried this and it does the trick!
In the midst of all this wrangling, I decide to write a simple test to spit out the value of the sun.jnu.encoding property. That test runs fine so next step is to use the same flags as the failing jtreg test. However, as I added the ZGC flags to the test command line, I realized that I hadn’t even tried those flags with the java -version. What an oversight! The bug reproduces without running any specific program!
Since the assert happens when cloning an array, I decided to find the native implementation of the clone method. Searched for “clone_” and the only relevant hit (from a quick glance) appeared to be in the LinkResolver::check_method_accessability method.
Command: C:/java/forks/openjdk/jdk/build/windows-aarch64-server-slowdebug/jdk/bin/java.exe

Arguments: -XX:+UseZGC -XX:+ZGenerational -XX:+ZVerifyOops -version

Working Dir: C:/java/forks/openjdk/jdk
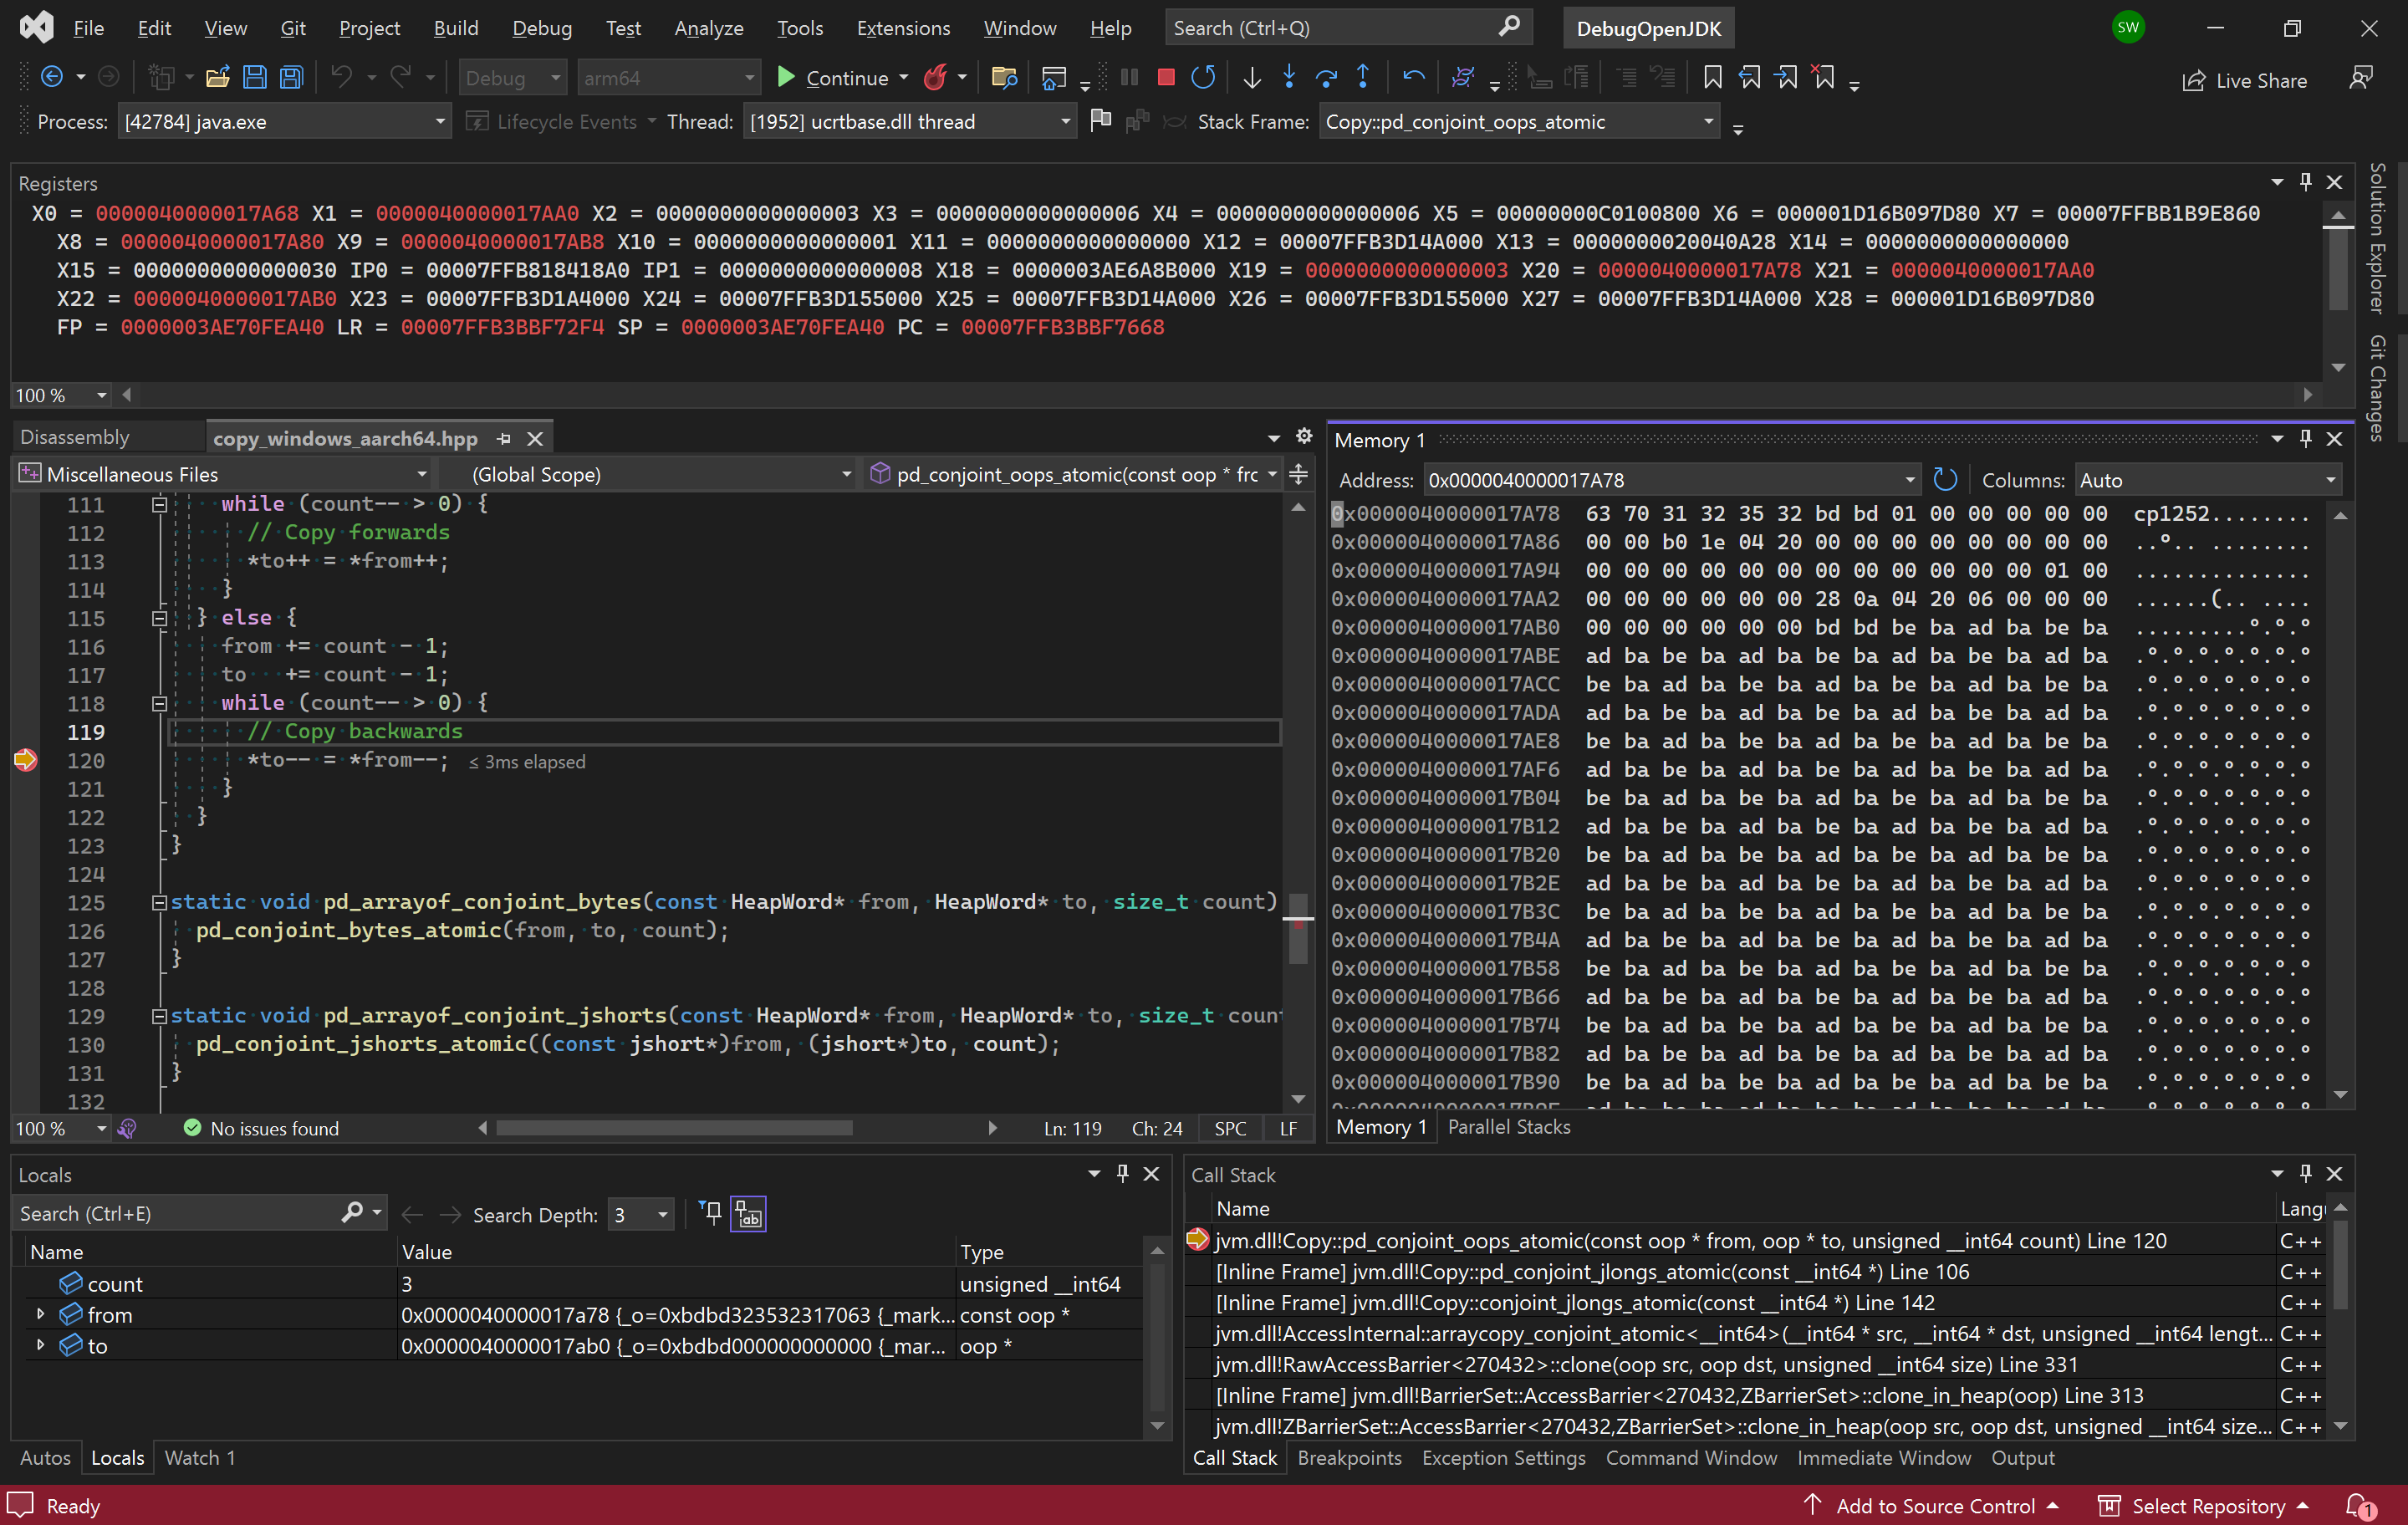
The failure appeared to be happening in this statement: HeapAccess<>::clone(obj(), new_obj_oop, size). I got this callstack by stepping into the calls in the slowdebug build because the is_valid function is inlined in the fastdebug build, preventing me from setting a breakpoint in it.
jvm.dll!is_valid(zaddress addr, bool assert_on_failure) Line 298	C++
jvm.dll!assert_is_valid(zaddress addr) Line 321	C++
jvm.dll!to_zaddress(unsigned __int64 value) Line 339	C++
jvm.dll!to_zaddress(oopDesc * o) Line 345	C++
jvm.dll!ZBarrierSet::AccessBarrier<270432,ZBarrierSet>::clone_in_heap(oopDesc * src, oopDesc * dst, unsigned __int64 size) Line 433	C++
jvm.dll!AccessInternal::PostRuntimeDispatch<ZBarrierSet::AccessBarrier<270400,ZBarrierSet>,9,270400>::access_barrier(oopDesc * src, oopDesc * dst, unsigned __int64 size) Line 200	C++
jvm.dll!AccessInternal::RuntimeDispatch<270400,oopDesc *,9>::clone_init(oopDesc * src, oopDesc * dst, unsigned __int64 size) Line 349	C++
jvm.dll!AccessInternal::RuntimeDispatch<270400,oopDesc *,9>::clone(oopDesc * src, oopDesc * dst, unsigned __int64 size) Line 533	C++
jvm.dll!AccessInternal::PreRuntimeDispatch::clone<270400>(oopDesc * src, oopDesc * dst, unsigned __int64 size) Line 890	C++
jvm.dll!AccessInternal::clone<262144>(oopDesc * src, oopDesc * dst, unsigned __int64 size) Line 1181	C++
jvm.dll!Access<262144>::clone(oopDesc * src, oopDesc * dst, unsigned __int64 size) Line 212	C++
jvm.dll!JVM_Clone(JNIEnv_ * env, _jobject * handle) Line 698	C++
00000298b2bbf056()	Unknown
00000298a2ee5590()	Unknown
000000c053dfe908()	Unknown
Here’s the stack from stepping into the fastdebug assembly (note that line numbers might be off since this is not slowdebug):
I looked at this and searched for UTF-8 byte 0xBD meaning – Search (bing.com) but that didn’t turn up anything meaningful. I noticed that count is 3 on my Aarch64 device so we are copying 3 oops. Was this expected given that the count is 4 on Windows x64? More importantly though, the big question I have now is why doesn’t slowdebug step into the oop checking code when pressing F11 on line 120 in the screenshot? I expected the behavior of oop::on_usage to be different, not that it wouldn’t be called at all! When browsing the sources in VSCode on my x64 desktop, I clicked on the oop type (of the src argument) and it took me to a typedef of class oopDesc*. That’s when I spotted the CHECK_UNHANDLED_OOPS ifndef. The fastdebug build must have this defined! The only non-cpp/hpp file that contains CHECK_UNHANDLED_OOPS is jdk/make/hotspot/lib/JvmFlags.gmk. Sure enough, it is only defined for fastdebug. This means that I should be able to enable it for slowdebug and release and verify whether the behavior is present there. We can therefore configure a slowdebug build with the --with-extra-cflags=-DCHECK_UNHANDLED_OOPS option.
date; time bash configure --with-jtreg=/cygdrive/c/java/binaries/jtreg-7.4+1 --with-gtest=/cygdrive/c/repos/googletest --with-boot-jdk=/cygdrive/c/java/binaries/jdk/x64/jdk-22.0.1+8 --openjdk-target=aarch64-unknown-cygwin --with-debug-level=slowdebug --with-extra-cflags=-DCHECK_UNHANDLED_OOPS

time /cygdrive/c/repos/scratchpad/scripts/java/cygwin/build-jdk.sh windows aarch64 0 slowdebug
Looking at the actual pointer, I noticed that its value is the data “cp1252..”. After further investigation, I conclude that the bug is that we’re calling oops::operator= instead of just copying the values! I test a fix that simply copies the values directly and it works! The test passes even with the -DCHECK_UNHANDLED_OOPS option!
On to the next question: is there anything else using the pd_conjoint_oops_atomic function (and will it be negatively affected by my change)? While searching for “pd_conjoint_oops_atomic”, I notice that some platforms have an assert that oops == long or smth like that. There are 2 users of pd_conjoint_oops_atomic:
One idea is to run Java programs on a build linked with /PROFILE (Performance Tools Profiler) i.e. configured via --with-extra-ldflags=-profile to enable collection of code coverage data then confirming that those functions are executed. That seems cumbersome though so I try to create some array copying code to see if I can get to those functions (using breakpoints but none are hit). After taking a break: I wonder if I can just search from the bottom instead? Looking in jvm.cpp for copy reveals the JVM_ArrayCopy function. Here is my Java program:
public class CopyArray {
    public static void main(String[] args) {
        int length = 0xdeadc0d;
        int srcPos = 0;

        if (args.length > 0) {
            try {
                int userLength = Integer.parseInt(args[0]);
                length = userLength;
            }
            catch (Throwable e) {
                System.err.println("Ignoring invalid user arguments.");
            }
        }

        byte[] src = new byte[length];

        for (int i = 0; i < src.length; i++) {
            src[i] = (byte)(i % 256);
        }
        byte[] dest = new byte[length];
        System.arraycopy(src, srcPos, dest, 0, length);
    }
}
I debugged the JVM running this program on my x64 machine. This hits the target function, JVM_ArrayCopy but there are so many callers. I have to set a condition on the breakpoint (hence the magic value of the length above) before I can step in to see where my call goes. Here are the source paths (note the different commit)
jvm.dll!Copy::pd_conjoint_bytes_atomic(const void * from, void * to, unsigned __int64 count) Line 119	C++
jvm.dll!Copy::conjoint_memory_atomic(const void * from, void * to, unsigned __int64 size) Line 53	C++
jvm.dll!AccessInternal::arraycopy_conjoint_atomic<void>(void * src, void * dst, unsigned __int64 length) Line 164	C++
jvm.dll!RawAccessBarrierArrayCopy::arraycopy<136585312,void>(arrayOop src_obj, unsigned __int64 src_offset_in_bytes, void * src_raw, arrayOop dst_obj, unsigned __int64 dst_offset_in_bytes, void * dst_raw, unsigned __int64 length) Line 298	C++
jvm.dll!RawAccessBarrier<136585312>::arraycopy<void>(arrayOop src_obj, unsigned __int64 src_offset_in_bytes, void * src_raw, arrayOop dst_obj, unsigned __int64 dst_offset_in_bytes, void * dst_raw, unsigned __int64 length) Line 308	C++
jvm.dll!AccessInternal::PreRuntimeDispatch::arraycopy<136587328,void>(arrayOop src_obj, unsigned __int64 src_offset_in_bytes, void * src_raw, arrayOop dst_obj, unsigned __int64 dst_offset_in_bytes, void * dst_raw, unsigned __int64 length) Line 834	C++
jvm.dll!AccessInternal::PreRuntimeDispatch::arraycopy<136585280,void>(arrayOop src_obj, unsigned __int64 src_offset_in_bytes, void * src_raw, arrayOop dst_obj, unsigned __int64 dst_offset_in_bytes, void * dst_raw, unsigned __int64 length) Line 867	C++
jvm.dll!AccessInternal::arraycopy_reduce_types<136585280,void>(arrayOop src_obj, unsigned __int64 src_offset_in_bytes, void * src_raw, arrayOop dst_obj, unsigned __int64 dst_offset_in_bytes, void * dst_raw, unsigned __int64 length) Line 1008	C++
jvm.dll!AccessInternal::arraycopy<136577024,void>(arrayOop src_obj, unsigned __int64 src_offset_in_bytes, const void * src_raw, arrayOop dst_obj, unsigned __int64 dst_offset_in_bytes, void * dst_raw, unsigned __int64 length) Line 1172	C++
jvm.dll!Access<136577024>::arraycopy<void>(arrayOop src_obj, unsigned __int64 src_offset_in_bytes, const void * src_raw, arrayOop dst_obj, unsigned __int64 dst_offset_in_bytes, void * dst_raw, unsigned __int64 length) Line 147	C++
jvm.dll!ArrayAccess<134217728>::arraycopy<void>(arrayOop src_obj, unsigned __int64 src_offset_in_bytes, arrayOop dst_obj, unsigned __int64 dst_offset_in_bytes, unsigned __int64 length) Line 301	C++
jvm.dll!TypeArrayKlass::copy_array(arrayOop s, int src_pos, arrayOop d, int dst_pos, int length, JavaThread * __the_thread__) Line 170	C++
jvm.dll!JVM_ArrayCopy(JNIEnv_ * env, _jclass * ignored, _jobject * src, int src_pos, _jobject * dst, int dst_pos, int length) Line 307	C++
00000244ea690702()	Unknown
Copy::conjoint_memory_atomic is interesting because it has a comment indicating that copying bytes is not aligned and so there is no need to be atomic. The if statements in that method indicate that I can change the size of elements in the array to call different paths. Looks like I need to create an array of objects.
/**
export JAVA_HOME=~/java/binaries/jdk/x64/jdk-21.0.2+13
$JAVA_HOME/bin/javac CopyArray.java
$JAVA_HOME/bin/java CopyArray
 */

public class CopyArray {
    public static void main(String[] args) {
        int length = 0xdead;
        int srcPos = 0;

        if (args.length > 0) {
            try {
                int userLength = Integer.parseInt(args[0]);
                length = userLength;
            }
            catch (Throwable e) {
                System.err.println("Ignoring invalid user arguments.");
            }
        }

        Object[] src = new Object[length];

        for (int i = 0; i < src.length; i++) {
            src[i] = new Object();
        }
        Object[] dest = new Object[length];
        System.arraycopy(src, srcPos, dest, 0, length);
    }
}
Now we are closer to the array_oops code I was trying to hit:
jvm.dll!Copy::pd_conjoint_jints_atomic(const int * from, int * to, unsigned __int64 count) Line 52	C++
jvm.dll!Copy::conjoint_oops_atomic(const narrowOop * from, narrowOop * to, unsigned __int64 count) Line 155	C++
jvm.dll!AccessInternal::arraycopy_conjoint_oops(narrowOop * src, narrowOop * dst, unsigned __int64 length) Line 54	C++
jvm.dll!RawAccessBarrierArrayCopy::arraycopy<50331750,HeapWordImpl *>(arrayOop src_obj, unsigned __int64 src_offset_in_bytes, HeapWordImpl * * src_raw, arrayOop dst_obj, unsigned __int64 dst_offset_in_bytes, HeapWordImpl * * dst_raw, unsigned __int64 length) Line 234	C++
jvm.dll!RawAccessBarrier<52715622>::arraycopy<enum narrowOop>(arrayOop src_obj, unsigned __int64 src_offset_in_bytes, narrowOop * src_raw, arrayOop dst_obj, unsigned __int64 dst_offset_in_bytes, narrowOop * dst_raw, unsigned __int64 length) Line 308	C++
jvm.dll!RawAccessBarrier<52715622>::oop_arraycopy<enum narrowOop>(arrayOop src_obj, unsigned __int64 src_offset_in_bytes, narrowOop * src_raw, arrayOop dst_obj, unsigned __int64 dst_offset_in_bytes, narrowOop * dst_raw, unsigned __int64 length) Line 130	C++
jvm.dll!ModRefBarrierSet::AccessBarrier<35938406,CardTableBarrierSet>::oop_arraycopy_in_heap<enum narrowOop>(arrayOop src_obj, unsigned __int64 src_offset_in_bytes, narrowOop * src_raw, arrayOop dst_obj, unsigned __int64 dst_offset_in_bytes, narrowOop * dst_raw, unsigned __int64 length) Line 109	C++
jvm.dll!AccessInternal::PostRuntimeDispatch<CardTableBarrierSet::AccessBarrier<35938406,CardTableBarrierSet>,8,35938406>::oop_access_barrier<HeapWordImpl *>(arrayOop src_obj, unsigned __int64 src_offset_in_bytes, HeapWordImpl * * src_raw, arrayOop dst_obj, unsigned __int64 dst_offset_in_bytes, HeapWordImpl * * dst_raw, unsigned __int64 length) Line 142	C++
jvm.dll!AccessInternal::RuntimeDispatch<35938374,HeapWordImpl *,8>::arraycopy(arrayOop src_obj, unsigned __int64 src_offset_in_bytes, HeapWordImpl * * src_raw, arrayOop dst_obj, unsigned __int64 dst_offset_in_bytes, HeapWordImpl * * dst_raw, unsigned __int64 length) Line 517	C++
jvm.dll!AccessInternal::PreRuntimeDispatch::arraycopy<35938374,HeapWordImpl *>(arrayOop src_obj, unsigned __int64 src_offset_in_bytes, HeapWordImpl * * src_raw, arrayOop dst_obj, unsigned __int64 dst_offset_in_bytes, HeapWordImpl * * dst_raw, unsigned __int64 length) Line 871	C++
jvm.dll!AccessInternal::arraycopy_reduce_types<35938372>(arrayOop src_obj, unsigned __int64 src_offset_in_bytes, HeapWordImpl * * src_raw, arrayOop dst_obj, unsigned __int64 dst_offset_in_bytes, HeapWordImpl * * dst_raw, unsigned __int64 length) Line 1018	C++
jvm.dll!AccessInternal::arraycopy<35913732,HeapWordImpl *>(arrayOop src_obj, unsigned __int64 src_offset_in_bytes, HeapWordImpl * const * src_raw, arrayOop dst_obj, unsigned __int64 dst_offset_in_bytes, HeapWordImpl * * dst_raw, unsigned __int64 length) Line 1172	C++
jvm.dll!Access<35913728>::oop_arraycopy<HeapWordImpl *>(arrayOop src_obj, unsigned __int64 src_offset_in_bytes, HeapWordImpl * const * src_raw, arrayOop dst_obj, unsigned __int64 dst_offset_in_bytes, HeapWordImpl * * dst_raw, unsigned __int64 length) Line 136	C++
jvm.dll!ArrayAccess<33554432>::oop_arraycopy(arrayOop src_obj, unsigned __int64 src_offset_in_bytes, arrayOop dst_obj, unsigned __int64 dst_offset_in_bytes, unsigned __int64 length) Line 327	C++
jvm.dll!ObjArrayKlass::do_copy(arrayOop s, unsigned __int64 src_offset, arrayOop d, unsigned __int64 dst_offset, int length, JavaThread * __the_thread__) Line 197	C++
jvm.dll!ObjArrayKlass::copy_array(arrayOop s, int src_pos, arrayOop d, int dst_pos, int length, JavaThread * __the_thread__) Line 282	C++
jvm.dll!JVM_ArrayCopy(JNIEnv_ * env, _jclass * ignored, _jobject * src, int src_pos, _jobject * dst, int dst_pos, int length) Line 307	C++
00000202d3f00502()	Unknown
00000202cc269950()	Unknown
In this call stack, the arraycopy_conjoint_oops(narrowOop* src, narrowOop* dst, size_t length) implementation that is called has narrow oops because of the branch in ObjArrayKlass::copy_array. Launch the application using these arguments instead:
Now the code block of interest is hit! Hmm, I’m realizing that I should have been explicit about the collector to use. This was debugging the G1 collector (chosen ergonomically).
jvm.dll!ZBarrierSet::AccessBarrier<52715590,ZBarrierSet>::oop_arraycopy_in_heap_no_check_cast(zpointer * dst, zpointer * src, unsigned __int64 length) Line 371	C++
jvm.dll!ZBarrierSet::AccessBarrier<35938374,ZBarrierSet>::oop_arraycopy_in_heap(arrayOop src_obj, unsigned __int64 src_offset_in_bytes, zpointer * src_raw, arrayOop dst_obj, unsigned __int64 dst_offset_in_bytes, zpointer * dst_raw, unsigned __int64 length) Line 403	C++
jvm.dll!ZBarrierSet::AccessBarrier<35938374,ZBarrierSet>::oop_arraycopy_in_heap(arrayOop src_obj, unsigned __int64 src_offset_in_bytes, oop * src_raw, arrayOop dst_obj, unsigned __int64 dst_offset_in_bytes, oop * dst_raw, unsigned __int64 length) Line 128	C++
jvm.dll!AccessInternal::PostRuntimeDispatch<ZBarrierSet::AccessBarrier<35938374,ZBarrierSet>,8,35938374>::oop_access_barrier<HeapWordImpl *>(arrayOop src_obj, unsigned __int64 src_offset_in_bytes, HeapWordImpl * * src_raw, arrayOop dst_obj, unsigned __int64 dst_offset_in_bytes, HeapWordImpl * * dst_raw, unsigned __int64 length) Line 142	C++
jvm.dll!AccessInternal::RuntimeDispatch<35938374,HeapWordImpl *,8>::arraycopy(arrayOop src_obj, unsigned __int64 src_offset_in_bytes, HeapWordImpl * * src_raw, arrayOop dst_obj, unsigned __int64 dst_offset_in_bytes, HeapWordImpl * * dst_raw, unsigned __int64 length) Line 517	C++
jvm.dll!AccessInternal::PreRuntimeDispatch::arraycopy<35938374,HeapWordImpl *>(arrayOop src_obj, unsigned __int64 src_offset_in_bytes, HeapWordImpl * * src_raw, arrayOop dst_obj, unsigned __int64 dst_offset_in_bytes, HeapWordImpl * * dst_raw, unsigned __int64 length) Line 871	C++
jvm.dll!AccessInternal::arraycopy_reduce_types<35938372>(arrayOop src_obj, unsigned __int64 src_offset_in_bytes, HeapWordImpl * * src_raw, arrayOop dst_obj, unsigned __int64 dst_offset_in_bytes, HeapWordImpl * * dst_raw, unsigned __int64 length) Line 1018	C++
jvm.dll!AccessInternal::arraycopy<35913732,HeapWordImpl *>(arrayOop src_obj, unsigned __int64 src_offset_in_bytes, HeapWordImpl * const * src_raw, arrayOop dst_obj, unsigned __int64 dst_offset_in_bytes, HeapWordImpl * * dst_raw, unsigned __int64 length) Line 1172	C++
jvm.dll!Access<35913728>::oop_arraycopy<HeapWordImpl *>(arrayOop src_obj, unsigned __int64 src_offset_in_bytes, HeapWordImpl * const * src_raw, arrayOop dst_obj, unsigned __int64 dst_offset_in_bytes, HeapWordImpl * * dst_raw, unsigned __int64 length) Line 136	C++
jvm.dll!ArrayAccess<33554432>::oop_arraycopy(arrayOop src_obj, unsigned __int64 src_offset_in_bytes, arrayOop dst_obj, unsigned __int64 dst_offset_in_bytes, unsigned __int64 length) Line 327	C++
jvm.dll!ObjArrayKlass::do_copy(arrayOop s, unsigned __int64 src_offset, arrayOop d, unsigned __int64 dst_offset, int length, JavaThread * __the_thread__) Line 198	C++
jvm.dll!ObjArrayKlass::copy_array(arrayOop s, int src_pos, arrayOop d, int dst_pos, int length, JavaThread * __the_thread__) Line 290	C++
jvm.dll!JVM_ArrayCopy(JNIEnv_ * env, _jclass * ignored, _jobject * src, int src_pos, _jobject * dst, int dst_pos, int length) Line 308	C++
000002602e8c06a8()	Unknown
I need to turn off compressed oops with the serial collector as well but it looks like there is no check_oop_function for the serial collector. That said, this exploration of array copying code was insightful, showing how the data type sizes determine which path is taken for copying primitives and objects. There didn’t appear to be any red flags about removing the oop::operator= usage so I opened 8334475: UnsafeIntrinsicsTest.java#ZGenerationalDebug assert(!assert_on_failure) failed: Has low-order bits set by swesonga · Pull Request #20390 · openjdk/jdk (github.com) to fix the assertion failure. The most interesting part of this investigation was that the bad address was a data value (cp1252) staring right at me and I missed it. This was quite educational for me though.
I have been learning about the SFrame tracing effort and figured I should document the resources I have reviewed. Indu Bhagat has been actively involved in the development of SFrame. This is one of her talks giving an overview of the objectives of SFrame. The overall idea is that profiling tools (e.g. perf) usually need to generate stack traces. She lists some methods used to generate stack traces, e.g. using frame pointers, EH frame, last branch record (LBR), and other heuristics. Each of these have their own advantages and pitfalls. SFrame encodes the minimal info required for stack tracing.
I found additional videos by searching for sframe indu (there are lots of unrelated sframe results out there). This one by Steven and Indu covers potential issues that need to be addressed for JITted code.
I have been using bash scripts to run jtreg tests when working on my Windows desktop. The Git Bash environment does not care about whether the script has the executable mode set. However, running the same script on other platforms requires a chmod +x command. Since it is annoying to have to do this every time I switch platforms, I have decided to be fixing this before pushing scripts. How do I see the permission of a file in Git? – Stack Overflow recommends git ls-files -s. It’s only now that I’m learning (from the top voted answer) that Git only tracks the executable bit on files (Are file permissions and owner:group properties included in git commits? – Stack Overflow).
chmod +x run-jtreg-test.sh does not change the file mode displayed by git ls-files -s. As per How to add chmod permissions to file in Git? – Stack Overflow, you can use this command starting in Git 2.9 (I’m running git version 2.45.2.windows.1)
I was recently in a brainstorming session with a colleague about garbage collection scenarios. He suggested using mind mapping software, and I must confess that this was the first time I was hearing about this (as far as I can recall). We wanted a free program. Our search turned up freeplane (which can be downloaded on Sourceforge). As per my usual habits, I decided to build it from source myself (I especially get this urge when I run into Sourceforge download links). Fortunately, the sources are hosted on GitHub.
git clone https://github.com/freeplane/freeplane
Since this is a Java codebase, I searched for “eclipse java” to get an IDE. The Eclipse Packages page has the Eclipse IDE for Java Developers (I downloaded the Windows x64 version). The project uses gradle but I didn’t know how to open it in Eclipse so I asked Microsoft Copilot (Bing Chat) how to “open a gradle project in eclipse”. One of the results was from the Import existing Gradle Git project into Eclipse – Stack Overflow page, which points to the Buildship Gradle Integration plugin. I launched Eclipse, created a new workspace and tried to import the project but got an exception that ended with:
Caused by: java.lang.IllegalArgumentException: Unsupported class file major version 65
	at groovyjarjarasm.asm.ClassReader.<init>(ClassReader.java:199)
	at groovyjarjarasm.asm.ClassReader.<init>(ClassReader.java:180)
	at groovyjarjarasm.asm.ClassReader.<init>(ClassReader.java:166)
	at groovyjarjarasm.asm.ClassReader.<init>(ClassReader.java:287)
	... 180 more
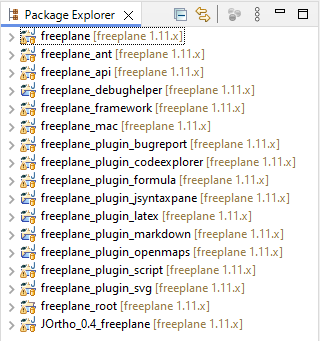
I was not sure how to run the application. I had unloaded it and reloaded it. I asked copilot “how to run an imported gradle project in eclipse” and the last step is to right-click on the project and choose Refresh to ensure Eclipse recognizes the changes. This time, the project explorer folders are rearranged, and version numbers are appended after each project!
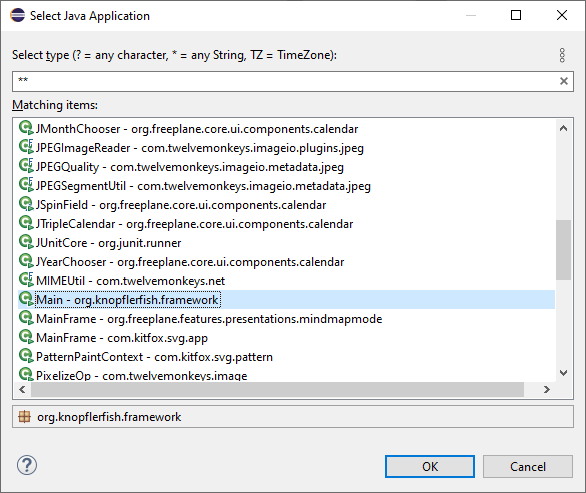
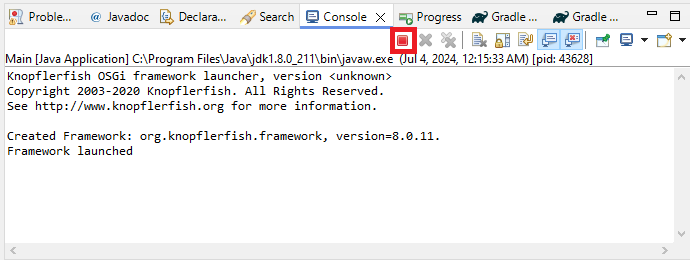
I right clicked on the freeplane project, selected Run As… Java Application, then chose the Main (org.knopflerfish.framework) application and clicked OK.
This text appeared in the console but no application Window appeared.
Knopflerfish OSGi framework launcher, version <unknown>
Copyright 2003-2020 Knopflerfish. All Rights Reserved.
See http://www.knopflerfish.org for more information.

Created Framework: org.knopflerfish.framework, version=8.0.11.
Framework launched
I was not even sure how to terminate the application so I asked copilot “how to stop a running java program in eclipse”. Yes, it has been that long. Forgot about this button.
I then downloaded freeplane_bin-1.11.14.zip to explore the UI and see if I could track down the strings from the menus… I found some resource files that but that was not helpful, so I continued exploring other projects. I finally stumbled into the freeplane_framework project. Clicking on “Run As… > Java Application” revealed that it has a Launcher project! I had been looking for a project like this. It failed with this error in the console window:
Exception in thread "main" java.lang.UnsupportedOperationException: The Security Manager is deprecated and will be removed in a future release
	at java.base/java.lang.System.setSecurityManager(System.java:430)
	at org.freeplane.launcher.Launcher.launchWithoutUICheck(Launcher.java:291)
	at org.freeplane.launcher.Launcher.main(Launcher.java:88)
I manually set the disableSecurityManager field to true to bypass this issue. The application finally launched!!
Launching Freeplane in Eclipse on macOS
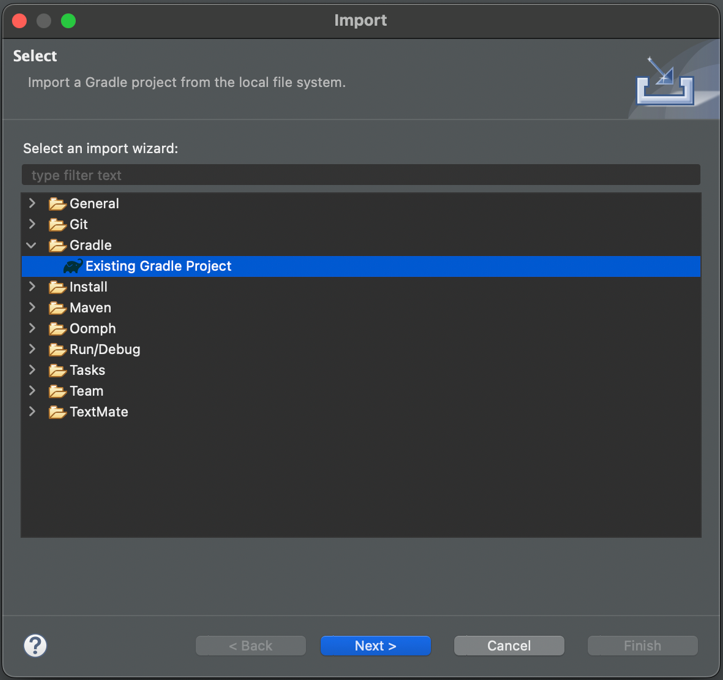
I decided to try this process on my M1 laptop. I downloaded the macOS AArch64 Eclipse IDE for Java Developers, accepted the default workspace path, and clicked on the “Import projects…” command in the package explorer. I selected the “Existing Gradle Project” import wizard then clicked Next.
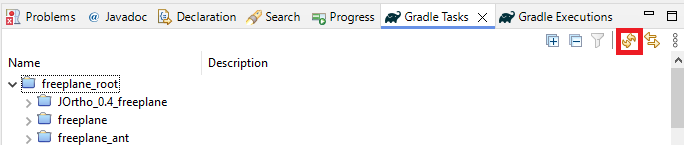
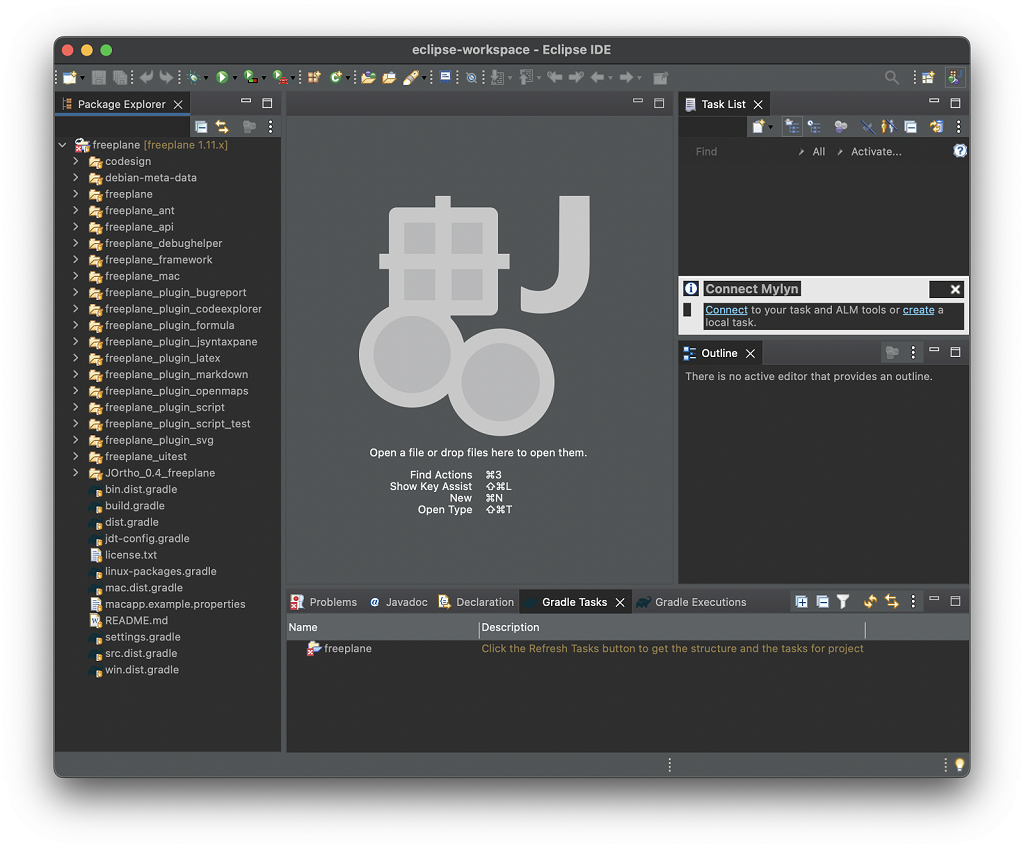
For the “Project root directory”, I browsed to the freeplane repo: /Users/saint/repos/freeplane then clicked on “Finish”. There is a helpful message in the Gradle Tasks pane (which shows up by default): Click on the Refresh Tasks button to get the structure and the tasks for project.
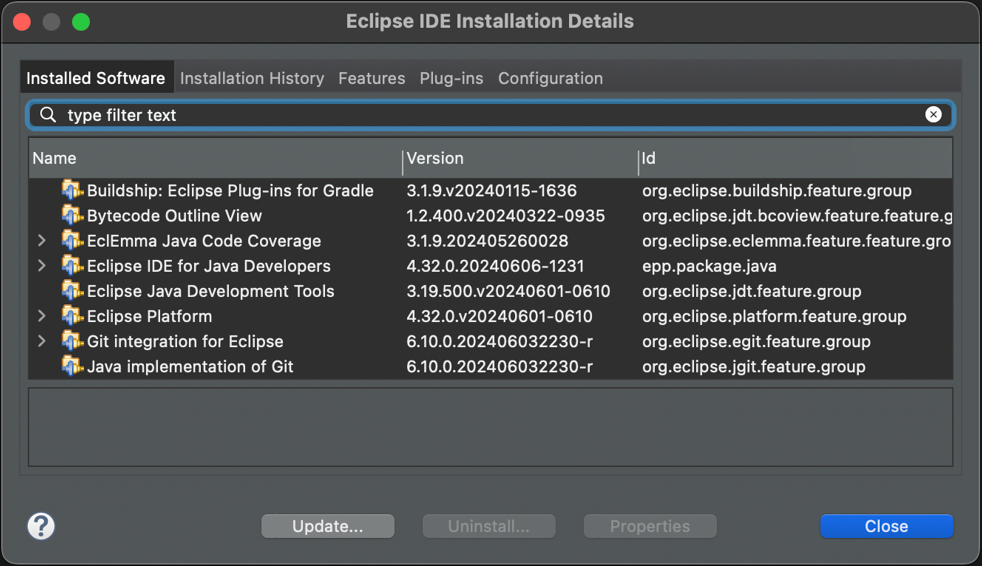
A message in the status bar flashed by fast but nothing else happened in the IDE. I confirmed that “Buildship: Eclipse Plug-ins for Gradle” was listed in the Installation Details (Eclipse > About Eclipse).
I didn’t have the console view of what could have happened though so I enabled it via Window > Show View > Console. Aha, looks like the same error that happened the first time in Windows (not even sure how that got resolved at this point).
FAILURE: Build failed with an exception.

* What went wrong:
Could not open cp_init generic class cache for initialization script '/Users/saint/eclipse-workspace/.metadata/.plugins/org.eclipse.buildship.core/init.d/eclipsePlugin.gradle' (/Users/saint/.gradle/caches/8.1.1/scripts/2to4is5l87jn9v7vrcgka57e).
> BUG! exception in phase 'semantic analysis' in source unit '_BuildScript_' Unsupported class file major version 65

* Try:
> Run with --stacktrace option to get the stack trace.
> Run with --info or --debug option to get more log output.
> Run with --scan to get full insights.

* Get more help at https://help.gradle.org

CONFIGURE FAILED in 568ms
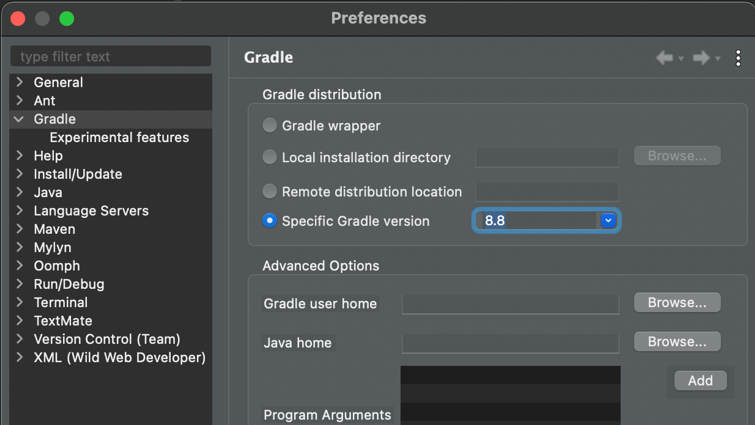
The Specific Gradle version dropdown has many options. I selected 8.8 then clicked on Apply and Close. Refreshing the Gradle Tasks still didn’t do anything. I closed the project and reopened it and now all the tasks showed up in the Gradle Tasks pane. However, the Run As option on the freeplane_framework project only had a Run Configurations… option. After some poking around, I discovered that just like on Windows, I need to expand the project, right click on the build.gradle file, then select the Gradle > Refresh Gradle Project to get the Package Explorer to refresh. This hides the top level files in the project. Now I could right click on the project and use the Run As > Java Application command. Selecting the “Launcher” Java application resulted in previously mentioned error message so I manually set the disableSecurityManager field to true. Freeplane finally launched successfully!
Summary: How to launch Freeplane in Eclipse
Clone the repo: git clone https://github.com/freeplane/freeplane
Set the gradle distribution to 8.8 (on Windows/Linux, use Window > Preferences, on macOS, use Eclipse > Preferences).
Click on Import projects… in the Package Explorer.
Select Existing Gradle Project then browse to the repo for the “Project root directory” (you can click Next to override the workspace settings to choose a specific Gradle version).
Click on Refresh Gradle Tasks.
Right click on the root build.gradle file and click on Refresh Tasks (if necessary, i.e. this file is shown at the root level of the package explorer)
Manually set the disableSecurityManager field to true to bypass the UnsupportedOperationException.
Run the “build” Gradle task in the Gradle Tasks window.
Right click on the freeplane_framework project, Run As > Java Application then select the Launcher application.
Select the freeplane dist option in the “Select Java Application” Window and click OK.
A colleague at work was telling me about the Smalltalk programming language this week. I have never used it so I asked for compiler recommendations for it. Dolphin smalltalk was one of the suggestions. I downloaded the ZIP of the latest release from https://github.com/dolphinsmalltalk/Dolphin/releases/tag/7.2.0 but unzipping it and launching it fails with a Fail to open image file 'C:\software\DolphinVM\DPRO.img7' error message. Downloading and running the Dolphin7Setup.exe installer got the Dolphin environment up and running.
Building Dolphin Smalltalk
I’m always interested in how different projects are built – this one stands out for being a Windows-only project. The repo I cloned was at commit 2cbc3e72cb.
Building Core/DolphinVM/DolphinVM.sln in Visual Studio takes less than a minute on my desktop. Pressing F5 shows an error dialog: Unable to start program 'C:\repos\Dolphin\Core\DolphinVM\Debug\DolphinVM8.dll'. Changing the startup project from VM to Launcher just shows the Fail to open image file 'C:\repos\Dolphin\Core\DolphinVM\Launcher\DPRO.img8' error. Looking at the repo home page, I think I have only built the virtual machine.
Building the Dolphin 8 Product Image
The instructions say to run git lfs pull but that doesn’t appear to do anything. Next step is to run BootDPRO.cmd. It calls Dolphin8 with the DBOOT.img8 argument. GitHub displays a note that this file is Stored with Git LFS. This note links to Managing large files – GitHub Docs and this is the first time I’m really looking at this. I don’t really understand why a file that’s less than 2MB needs this so I will skip this LFS detail for now. Running the command in BootDPRO.cmd in my MINGW shell does not do anything.
Switching to a Windows command prompt does the trick! I’m still in the dark about what this machine is and what exactly this image being compiled is.
C:\repos\Dolphin>BootDPRO.cmd
Dolphin Smalltalk Boot
Copyright (c) Object Arts Ltd, 1997-2021.
Boot started at 2024-06-27T21:33:14.671937943-06:00
Loading boot script...
Reloading BCL constants pools...
Updating ClassBuilder...
Reloading BCL class definitions...
Recompilation of OpcodePool required because class variables/constants are being added
...
Reloading 'Dolphin Message Box' ...
Loading source package 'Dolphin Message Box' from: C:\repos\Dolphin\Core\Object Arts\Dolphin\System\Win32\MessageBox\Dolphin Message Box.pax
Deleting obsolete boot image methods...
Removing obsolete boot image method Compiler class>>#notificationCallback:
...
Recompiling references to ICONDIR (size 22)...
Recompiling references to PROCESS_INFORMATION (size 16)...
Recompiling references to STARTUPINFOW (size 68)...
Boot completed at 2024-06-27T21:36:03.2736891-06:00, duration 2.81 minutes
Launching Dolphin8
We can now run Dolphin using this command:
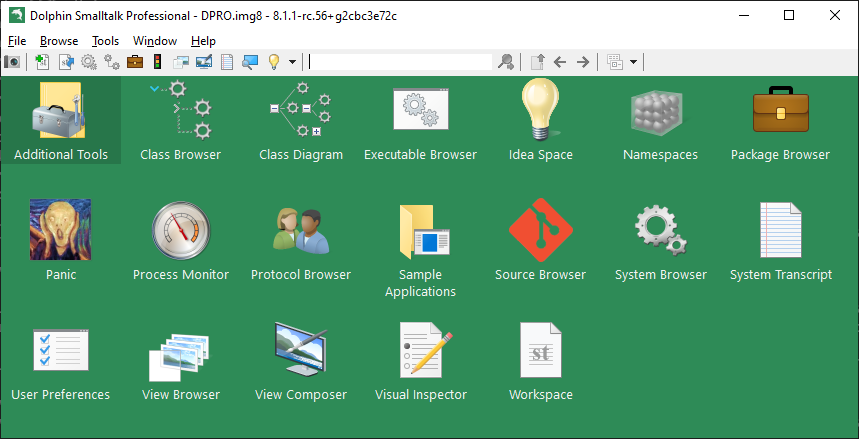
Dolphin8.exe DPRO.img8
The program launches successfully. Note that Dolphin8.exe is the output of the Launcher project. To debug the application:
Set Launcher as the startup project in Visual Studio.
Open the Property Pages of the Launcher project.
Navigate to the Configuration Properties > Debugging pane.
Set the Command Arguments to “DPRO.img8”
Set the Working Directory to the root of the git repo, e.g. “C:\repos\Dolphin”
Press OK then launch the program.
Ideally, these steps should be built into the solution and the launcher project’s configuration but it was straightforward to figure out. This is what I get.
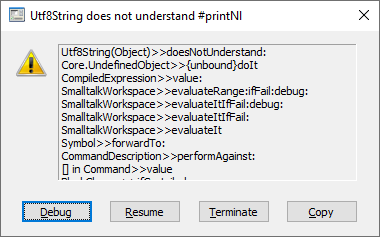
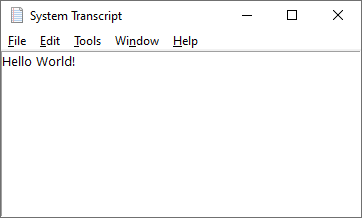
I evaluated this line, but nothing appeared to be happening. I reread the quote then search for the Transcript window. It is the System Transcript window shown below (whose icon is in the Dolphin Smalltalk Professional screenshot above). Sure enough, it contains the Hello World message.
System Transcript Window
As pointed out by my colleague and others like Dolphin Smalltalk 7 (randycoulman.com), picking up this language can make you a better programmer. I’ll need to find a decent program to implement in Smalltalk to learn about this programming language.
To build and run the JMH benchmark, ensure Maven is installed (the mvn command should be available in the shell). On Ubuntu, this is as easy as running sudo apt install maven then setting up JMH using the steps below.
git clone https://github.com/swesonga/benchmarks
cd benchmarks
cd java/jmh
./setup_jmh_jdk_micros.sh
./run_jmh_jdk_micros.sh Parallel 1 2 10 5 5
The setup_jmh_jdk_micros.sh script builds the JMH JDK microbenchmarks and the run_jmh_jdk_micros.sh run the benchmark. Someone recently asked why there are 2 java processes shown in top when the run_jmh_jdk_micros.sh script runs given that it launches only 1 java process. I learned from this site how to use top to see java processes only: run top, type ‘o’, then type ‘COMMAND=java’ and press ENTER. This is the resulting output from the top command:
top - 22:15:21 up  8:15,  1 user,  load average: 1.73, 0.66, 0.30
Tasks: 330 total,   1 running, 329 sleeping,   0 stopped,   0 zombie
%Cpu(s): 20.9 us,  0.6 sy,  0.0 ni, 78.3 id,  0.0 wa,  0.0 hi,  0.2 si,  0.0 st
MiB Mem :  15415.5 total,   5837.9 free,   5436.0 used,   4141.6 buff/cache
MiB Swap:   2048.0 total,   2048.0 free,      0.0 used.   9568.6 avail Mem

    PID USER      PR  NI    VIRT    RES    SHR S  %CPU  %MEM     TIME+ COMMAND
  22007 saint     20   0 5009436   1.1g  22464 S 345.3   7.2   1:02.74 java
  21927 saint     20   0 5607592   1.1g  23100 S   0.3   7.2   0:01.08 java
Sure enough, there are 2 java processes, each with 1.1g RES. This can also be confirmed by running the ps -aux | grep java command.
Notice that one of the processes has an IP address and what is most likely a port number. Without knowing anything else, this would suggest a client/server model in use. To better understand why there are 2 java processes, let us see look at how the run script launches Java. It passes flags like -f 1 to the benchmark jar file. What parses these flags?
The benchmark JAR file is created from a pom.xml file containing a mainClass attribute of org.openjdk.jmh.Main. That’s the class responsible for parsing these flags. This Main class uses the CommandLineOptions class to parse arguments like -f 1 then executes the Runner.run() method. Runner.runBenchmarks() checks whether the benchmarks should be run embedded or forked. runBenchmarksEmbedded() has a warning about using non-forked runs only for debugging purposes. This answers the question of why there are 2 JVMs: we are running in forked mode. runSeparate() has a getForkedMainCommand() method, which suggests that there is most likely a way to pass custom arguments to the ForkedMain JVM.
Now that we understand why there are 2 JVMs, can we control the heap size of each of them independently? The CommandLineOptions class has a list of all the supported arguments. Notice the jvmArgs, jvmArgsAppend, and jvmArgsAppend arguments! These suggest that we can indeed control the heap sizes of each of the JVMs. Use the jvmArgsAppend flag in the run_jmh_jdk_micros.sh script (e.g. just before the benchmark_filter_regex to specify a custom heap size for the forked java process (independent of the jvm_heap_size_opts).
Installing Maven
I did not have Java set up on my Ubuntu VM. Therefore, setting up MVN installed Java and many other dependencies. I decided to list these here for future reference.
saint@vm1ubuntu:~/java$ sudo apt install maven
Reading package lists... Done
Building dependency tree... Done
Reading state information... Done
The following additional packages will be installed:
  ca-certificates-java default-jre-headless java-common libaopalliance-java libapache-pom-java libatinject-jsr330-api-java libcdi-api-java libcommons-cli-java
  libcommons-io-java libcommons-lang3-java libcommons-parent-java libgeronimo-annotation-1.3-spec-java libgeronimo-interceptor-3.0-spec-java libguava-java
  libguice-java libhawtjni-runtime-java libjansi-java libjansi-native-java libjsr305-java libmaven-parent-java libmaven-resolver-java libmaven-shared-utils-java
  libmaven3-core-java libplexus-cipher-java libplexus-classworlds-java libplexus-component-annotations-java libplexus-interpolation-java libplexus-sec-dispatcher-java
  libplexus-utils2-java libsisu-inject-java libsisu-plexus-java libslf4j-java libwagon-file-java libwagon-http-shaded-java libwagon-provider-api-java
  openjdk-11-jre-headless
Suggested packages:
  default-jre libaopalliance-java-doc libatinject-jsr330-api-java-doc libel-api-java libcommons-io-java-doc libcommons-lang3-java-doc libasm-java libcglib-java
  libjsr305-java-doc libmaven-shared-utils-java-doc liblogback-java libplexus-classworlds-java-doc libplexus-sec-dispatcher-java-doc libplexus-utils2-java-doc junit4
  testng libcommons-logging-java liblog4j1.2-java fonts-dejavu-extra fonts-ipafont-gothic fonts-ipafont-mincho fonts-wqy-microhei | fonts-wqy-zenhei
The following NEW packages will be installed:
  ca-certificates-java default-jre-headless java-common libaopalliance-java libapache-pom-java libatinject-jsr330-api-java libcdi-api-java libcommons-cli-java
  libcommons-io-java libcommons-lang3-java libcommons-parent-java libgeronimo-annotation-1.3-spec-java libgeronimo-interceptor-3.0-spec-java libguava-java
  libguice-java libhawtjni-runtime-java libjansi-java libjansi-native-java libjsr305-java libmaven-parent-java libmaven-resolver-java libmaven-shared-utils-java
  libmaven3-core-java libplexus-cipher-java libplexus-classworlds-java libplexus-component-annotations-java libplexus-interpolation-java libplexus-sec-dispatcher-java
  libplexus-utils2-java libsisu-inject-java libsisu-plexus-java libslf4j-java libwagon-file-java libwagon-http-shaded-java libwagon-provider-api-java maven
  openjdk-11-jre-headless
0 upgraded, 37 newly installed, 0 to remove and 72 not upgraded.
Need to get 52.7 MB of archives.
After this operation, 189 MB of additional disk space will be used.
Do you want to continue? [Y/n]
The build_llvm_release.bat script in the LLVM repo is used to create a release build for Windows. Running it without any arguments displays a sample command line to use to build LLVM.
cd \repos && mkdir llvmcd \repos\llvm\llvm-project\llvm\utils\release
C:\> cd \repos\llvm\llvm-project\llvm\utils\release
C:\repos\llvm\llvm-project\llvm\utils\release> build_llvm_release.bat
--version option is required
=============================
Script for building the LLVM installer on Windows,
used for the releases at https://github.com/llvm/llvm-project/releases
Usage: build_llvm_release.bat --version <version> [--x86,--x64, --arm64]
Options:
--version: [required] version to build
--help: display this help
--x86: build and test x86 variant
--x64: build and test x64 variant
--arm64: build and test arm64 variant
Note: At least one variant to build is required.
Example: build_llvm_release.bat --version 15.0.0 --x86 --x64
Let us build version 17.0.1, which is the latest LLVM release. Open an administrator Developer Command Prompt then run:
:: set PATH=%PATH%;C:\Program Files\7-Zip
build_llvm_release.bat --version 17.0.1 --x64
The first error is caused by mv not being a standard command in the Windows command prompt. There are ways to create aliases, e.g. alias – Aliases in Windows command prompt – Stack Overflow but given that this is a batch file, why not just use the built-in function? I fix this in the script.
C:\repos\llvm\llvm-project\llvm\utils\release\llvm_package_17.0.1> mv llvm-project-* llvm-project   || exit /b 1
'mv' is not recognized as an internal or external command,
operable program or batch file.
The build directory needs to be deleted before restarting the build with the fix. Otherwise, the script will fail.
However, from a new command window, it looks like it hasn’t been set up.
C:\repos> python --version
Python was not found; run without arguments to install from the Microsoft Store, or disable this shortcut from Settings > Manage App Execution Aliases.
Just running python loads the Microsoft Store:
I proceed with the Customize Installation option in the open Python installer, this time selecting “for all users (requires admin privileges)”.
I’m not sure why the “Install Python 3.11 for all users” option is not checked on the “Advanced Options” page.
Opening a new command prompt then running python still gives the same behavior as before. where python shows that the new installation appears 2nd.
C:\repos> where python
C:\Users\saint\AppData\Local\Microsoft\WindowsApps\python.exe
C:\Python311\python.exe
The PATH environment variable has these paths in reverse order so I don’t understand what is happening. Looks like the easiest way forward is to just install python from the Microsoft Store – this at least ensures that python scripts can run. After a failure due to the python command not being found, closer inspection of build_llvm_release.bat reveals that it needs the PYTHON_HOME environment variable to be set. However, that is set on line 358 using the python_dir variable, which is in turn the first argument to :set_environment. The call to set_environment is from :do_build_32 (or do_build_64), which uses a hard-coded python path! The script should first validate the python installation and exit early if it cannot be found! I should have reported/fixed these when I worked on Tracking Down Missing Headers in LLVM for Windows – Saint’s Log (swesonga.org) last year.
Build Errors
With the Python path fixed, the build proceeds but the C++ compilation fails. A few months ago I got the error below build version 15.0.7. Unfortunately, I didn’t explicitly note the compiler version.
FAILED: tools/clang/lib/Analysis/FlowSensitive/CMakeFiles/obj.clangAnalysisFlowSensitive.dir/HTMLLogger.cpp.obj
C:\PROGRA~1\MICROS~3\2022\COMMUN~1\VC\Tools\MSVC\1438~1.331\bin\Hostx64\x64\cl.exe  /nologo /TP ... -c C:\repos\llvm\llvm-project\llvm\utils\release\llvm_package_17.0.1\llvm-project\clang\lib\Analysis\FlowSensitive\HTMLLogger.cpp
C:\repos\llvm\llvm-project\llvm\utils\release\llvm_package_17.0.1\llvm-project\clang\lib\Analysis\FlowSensitive\HTMLLogger.cpp(332): fatal error C1001: Internal compiler error.
(compiler file 'msc1.cpp', line 1587)
 To work around this problem, try simplifying or changing the program near the locations listed above.
If possible please provide a repro here: https://developercommunity.visualstudio.com
Please choose the Technical Support command on the Visual C++
 Help menu, or open the Technical Support help file for more information
Additional troubleshooting is obviously required to make progress here. I might try to create a narrowed down testcase for the internal compiler error or perhaps just report it as is and let the Visual C++ team figure that out.