While learning about large language models, the issue of vanishing gradients came up. What is a gradient? I attempted to describe it as the difference between where you are and where you want to be (the target), which is given by the loss function. This led to the question of what exactly a loss function is. The video below from IBM Technology explains loss functions: a loss function is an evaluation metric (how well is the model performing) and/or a guide that directs the model’s learning process.
What is a Loss Function? Understanding How AI Models Learn
The primary reason for calculating the loss function is to guide the model’s learning process. It provides a numeric value that indicates how far off the model’s predictions are from the actual results. By analyzing the loss, the model’s parameters can be adjusted (optimization) since the loss function is a feedback mechanism to the model, telling it how well it is performing and where it needs to improve. – What is a Loss Function? Understanding How AI Models Learn
A smaller value of the loss function indicates that the performance of the model has improved.
The gradient of the loss function is useful because it enables algorithms to determine which adjustments (e.g. to weights) will result in a smaller loss. The next video on Gradient descent, how neural networks learn is a helpful introduction to how loss functions are used to guide learning.
Gradient descent, how neural networks learn | DL2
Backpropagation is the algorithm used to compute the gradient. This video from 3Blue1Brown is a helpful explanation of what backpropagation is:
Backpropagation, intuitively | DL3
Two important phenomena in gradient descent are the problems of vanishing and exploding gradients. The Vanishing & Exploding Gradient explained | A problem resulting from backpropagationvideo describes these problems as follows: vanishing gradients mean that updated weights earlier in the network barely change (stuck) which means that the rest of the network cannot really minimize the loss function (i.e. learn). Exploding gradients mean that the earlier weights now increase so much that the optimal value of the loss function will never be achieved because weights become too big too quickly.
Vanishing & Exploding Gradient explained | A problem resulting from backpropagation
The focus of part 3 of this series is on the different types of wired networks. A key aspet of many networks is that QoS is just one concern, another key issue being how to meet guarantees for delivery of voice services. How is voice delivered? Integrated Services Digital Network (ISDN) is an international standard for voice, video, and data transmission over digital telephone or copper lines. It has two service levels. The first is Basic Rate Interface (BRI), which supports 2 bearer channels at 64kbps each and 1 D channel at 16 kbps. The second is the Primary Rate Interface (PRI), which supports 23 bearer channels (in the US) at 64 kbps each and 1 D channel at 16 kbps. The signaling/data (D) channel runs the ISDN signaling protocol based on Q.931. This video is a good high level introduction of ISDN. T1 and ISDN are used in access networks, together with technologies like IP and MPLS.
ISDN – Integrated Services Digital Network
Optical Networks
In newer generations of networks, the core is fiber (instead of copper) because it can deliver terabits per second. Installation and management of fiber networks is also much easier than copper networks. Fiber optic signals are analog – (in the infrared range).
What is the ELECTROMAGNETIC SPECTRUM
Light sources used for fiber optic communication include light-emitting diodes (LEDs), laser diodes, vertical cavity surface emitting lasers (VCSELs), Fabry-Perot lasers, and distributed feedback lasers.
How LED Works – Unravel the Mysteries of How LEDs Work!
The packet transport network is another key piece to understand. Customers send traffic to metro access, aggregation, and core portions of the network where voice and data are converged. In the packet core, wavelengths are being added and dropped by add-drop multiplexers. There are several types of ADMs with links to explanations about them from various vendors:
Open ROADM, which works to address the fact that optical systems have been proprietary (e.g. because SD FEC algorithms) on transponders are not interoperable and there are proprietary control loops between transponders and other optical components).
The next video gave me a better understanding of customer concerns with ROADMs and FOADMs.
Tutorial: To ROADM or Not to ROADM: When does a FOADM make sense in your optical network?
Other major types of network components include amplifiers, regenerators, and equalization nodes. Transponders map client side signals to wavelengths for high speed transport. They can be contained in a field-replaceable unit (FRU). Common types of pluggable optics include SFP+ (Small Form-factor Pluggable), CFP4, and QSFP28. Amplification is an analog process of boosting signal strength and is done in the optical domain (no conversion to electrical). Any impairments in the signal are boosted as well. A single pump laser is used for this. Regeneration can reshape and retime the optical signal but requires conversion to the electrical domain then back to the optical domain, making it more expensive to implement.
How a Fiber Laser Works
Major types of amplifiers in optical networks include EDFA (Erbium Doped Fiber Amplifer), Raman amplifier, and Hybrid Raman-EDFA amplifier. These are great explanations of these amplifiers:
Working Principle of Erbium Doped Fiber Amplifier (EDFA)
The EDFA – how it was developed.
Wavelength Selective Switch (WSS) was first implemented using MEMS but did’t work well because the hinges would fail. Liquid Crystal on Silicon (LCoS) is now commonly used to implement WSS since it has no moving parts. It can also support Flexgrid.
What is LCoS Based Wavelength Selective Switch – FO4SALE.COM
Optical patch panels are another component in fiber networks. They are used to join optical fibers where a connect/disconnect capability is required.
Handling Failure
There are 2 types of protection in networks:
Network protection: ensures that customer SLAs are met by preventing failures. Optical protection examples include mesh restoration (GMPLS, SDN), SNCP (OTN), UPSR & BLSR for SONET, and 1+1 or 1:1 circuits (active vs inactive backup circuit). Packet protection examples include MPLS fast reroute, LAG, G.8031, G.8032.
Equipment protection: focuses on protecting individual nodes.
I couldn’t emphasize this enough: this is such a broad field with so many technologies! What an introduction to networking!
The previous post introduced different types of networks and some of their architectural details. In this post, we look at the biggest problem network engineers work on: congestion. How are networks designed to address it? The professor starts tackling this area with a discussion of Quality of Service (QoS). Quality is defined in terms of the underlying requirements e.g. throughput, delay, jitter, packet loss, service availability, and per-flow sequence preservation. Services can be best effort, or other classes like gold service. Cisco’s Quality of Service (QoS) document discusses four levels of metal policy (platinum, gold, silver, and bronze), for example.
Class of Service (CoS) is a traffic classification that enables different actions to be taken on individual classes of traffic. Contrast this to type of service (ToS), which is a specific field in the IPv4 header (used to implement CoS). Juniper Networks post on Understanding Class of Service (CoS) Profiles equates QoS and CoS, but the professor explains that QoS is a more abstract concept than CoS.
QoS is a set of actions that the network takes to deliver the right delay, throughput, etc. QoS timeframes affect the way congestion is handled. For example, scheduling and dropping techniques and per-hop queuing are useful for the low millisecond time regime common in web traffic. Congestion over hundreds of milliseconds typically affects TCP (e.g. round trip times, closed-loop feedback) and this is addressed via methods like active queue management (AQM) and congestion control techniques like random early detection (RED). Congestion that occurs in the tens of seconds to minutes range is addressed by capacity planning.
How is QoS achieved in the data and control planes? By queuing, scheduling, policing, and dropping. The roles of the data and control planes are quite extensive as per the router diagram used to describe them. This is without getting into the details of the management plane e.g. the element management systems (per node) and the network management systems they communicate with. Control plane QoS mechanisms handle admission control and resource reservation and are typically implemented in software. Resource Reservation Protocol (RSVP) is the protocol mostly used in practice for control plane QoS. There are many explanations on RSVP, e.g. this Introduction to RSVP and this RSVP Overview. The primary QoS architectures are integrated services (Intserv) and differentiated services (Diffserv). Intserv uses RSVP and although it doesn’t scale, it is useful when guaranteed service is required.
We start a deep dive into the QoS techniques with queuing. There are different types of queues: first come first served (FCFS/FIFO), priority queues, and weighted queues. Packet schedulers can have a mix of these approches, e.g. 1 priority queue and N other weighted queues. Performance modeling can be done on queues. For voice traffic, the distribution of the arrival rate of traffic is a Poisson distribution. Therefore, the delay of packets and the length of the queue can be accurately modeled/predicted! See M/M/1 queues as a starting point (M/M/1 is Kendall notation and is more fully described in the next video).
Queuing Theory Tutorial – Queues/Lines, Characteristics, Kendall Notation, M/M/1 Queues
Data Plane QoS Mechanisms
These data plane QoS mechanisms are applied at each network node: classification, marking, policing and shaping, prioritization, minimum rate assurance. Below are more details about each.
Classification
This is the process of identifying flows of packets and grouping individual traffic flows into aggregated streams such that actions can be applied to those flow streams. Up to this point, I have had a vague idea of what a flow is but not a proper definition. The instructor defines a flow as a 5-tuple of source & destination IP addresses and TCP/UDP ports and a transport protocol. What is a Network Traffic Flow? discusses various ways of defining a flow, and this is just one of many. Classification needs to avoid fragmentation because the 5-tuple information is only in the first packet. There are 4 ways of classifying traffic:
Simple classification – the use of fields designed for QoS classification in IP headers e.g. the type of service (TOS) byte in IPv4. There are complications with using the DTRM bits of the TOS (e.g. minimizing delay and maximizing throughput could conflict).
Implicit classification – done without inspecting packet header or content, e.g. by examining layer 1 or 2 identifiers.
Complex classification – using fields not designed for QoS classification or layer 2 criteria like MAC addresses.
This is simply setting the fields assigned for QoS classification in IP packet headers (DSCP field) or MPLS packet headers (EXP field).
Source marking is applied at the source of the packets
Ingress marking: used when source cannot mark correctly or cannot be trusted to do so.
Rate Enforcement
This is done to avoid congestion. Policing is a mechanism to ensure that a traffic stream does not exceed a defined maximum rate. It stands in constrast to shaping, which is typically accomplished by queuing (delays traffic, never drops it). One type of policer is the token bucket policer. It never delays traffic and cannot reorder or reprioritize traffic. See Cisco’s Policing and Shaping Overview and QoS Policing documents for details. This is one of the rate limiting algorithms discussed in the video below (I found this video’s explanation more intuitive).
Five Rate Limiting Algorithms ~ Key Concepts in System Design
The next stage is prioritization of the traffic. 4 possible approaches: with prioritiy queues, e.g. where VoIP traffic always has highest priority, other queues can be starved by the scheduler. Weighted round robbin will take more packets from the high priority queues but still cycle through the other queues, taking fewer packets from them. Weighted bandwidth scheduling considers the packet sizes instead of just packet counts per queue (e.g. just taking 1 packet from a low priority queue can have negative impact if the packet is huge). Deficit round robbin is the one used in practice. It keeps track of the history of the number of packets services, and not just instantaneous values. I found the next video to expand on these brief explanations of scheduling algorithms.
How Do Schedulers in Routers Work? Understanding RR, WRR, WFQ, and DRR Through Simple Examples
One of the points that came up in discussion was that the schedulers use Run-to-completion scheduling, which means that a packet must be fully processed before starting on another packet. Routers have an interface FIFO (Tx buffer) on the physical link. When it fills up, this signals to the scheduler that there may be congestion downstream, thereby allowing for back pressure flow control. There is also multi-level strict policy queuing which allows for multiple priority queues instead of just 1 (e.g. voice & video) but not as common today.
Routers also drop packets to prevent unacceptable delays caused by buffering too many packets. There are different dropping strategies, e.g. tail dropping (dropping from the back of the queue), weighted tail dropping (>1 queue limit via heuristics), and head dropping (rare).
Active queue management (AQM) is a congestion avoidance technique. It works by detecting congestion before queues overflow. These are some techniques for AQM:
These QoS mechanisms operate in the context of an overriding architecture, integrated services (Intserv) or differentiated services (Diffserv). IntServ can be used in the financial industry or medical health facilities, for example. These are delay sensitive applications where unbounded scaling is not a real requirement. IntServ explicitly manages bandwidth resources on a per flow basis. DiffServ was developed to support (as the name suggests) differentiated treatment of packets in large scale environments. It does this using a 6-bit differentiated services code point (DSCP) in the IPv4 ToS header or the IPv6 traffic class octet. Classification and conditioning happen at the edge of the DiffServ domain. Actions are performed on behavior aggregates (contrast this to the per flow actions of IntServ). The next technology we learn about is Multiprotocol Label Switching, defined as follows on Wikipedia:
MPLS is similar to IntServ in that it lets you define an end-to-end path through the network for traffic but without reserving resources. It is a hop by hop forwarding mechanism, which stands in contrast to IP which works by making next hop routing decisions without regard to the end-to-end path taken by the packets. MPLS can be deployed on any layer 2 technology (multiprotocol). Benefits of MPLS include fast rerouting in case of failures and providing QoS support. One of the settings in which MPLS is used is in SD-WAN. This article provides a helpful contrast: What is the difference between SD-WAN and MPLS? These are the main applications of MPLS:
Traffic Engineering: allows network administrator to make the path deterministic (normal hop-by-hop routing is not). In other words, a frame forwarding policy can be used instead of relying on dynamic routing protocols.
QoS: the MPLS EXP bits are used for marking traffic per the labels.
This is quite the array of topics, especially for an introduction to networks course. I have a greater appreciation of how broad this space is.
I’m taking an online introductory course on networks. I have been surprised by how much ground this course is covering. I didn’t expect to cover wireless (mobile) networks, for example. I looked for videos on some of the topics to learn more, e.g. 4g network architecture – YouTube. Networking is turning out to be much cooler and more interesting than I thought possible. This post is a compilation of all the key topics introduced in the course (in the general order they were introduced, but not particularly organized into a coherent story).
My main takeaway from this first video is that 4G networks are entirely packet switched (basic, but new to me).
4G LTE Network Architecture Simplified
The next video on how messages are transmitted to the cell phone tower is insightful as well. I appreciated the high-level discussion of antennas.
How WiFi and Cell Phones Work | Wireless Communication Explained
The concept of control plane and data plane came up as well. One advantage of this separation as per the overview below are independent evolution and development of each (e.g. control software can be upgraded without changing the hardware).
M2.1: Overview of Control and Data Plane Separation
5G Service Based Architecture | Telecoms Bytes – Mpirical
Then of course there are the fundamental concepts of throughput, delay, and packet loss error. Jim Kurose’s book (and video below) covers these topics but it’s been a while since I read that book.
The professor also clarified the difference between bandwidth and throughput. The next video briefly touches on this distinction:
The course has also introduced me to the concept of spectral efficiency as part of understanding the difference between bandwidth and throughput. There is no shortage of concepts to learn about, from the different types of lines like T1 and T3 to bit robbing to the existence of network interface devices. The video below is good intro to T1.
DS1 (T1) Fundamentals
There was also a discussion about cable networks, with an onslaught of concepts like Hybrid fiber-coaxial. This Cable 101 video is a helpful resource.
The HFC Cable Systems Introduction video below starts out with a comparison of coax and fiber then explains the flow of signals from the core network to the home.
HFC Cable Systems Introduction
I still need to learn more information about the Cable modem termination system (CMTS) and the next resource is perfect. It mentions CMTS vendors like Arris, Cisco, and Motorola, which inspires me to look up the Cisco CMTS.
Cable Modem Termination System Tutorial (CMTS)
I have never researched how most of these systems work so I am greatly appreciating this introduction to networks course! Here’s a video on how cable modems work, including their interactions with the CMTS.
How Cable Modems Work
The communication between the CMTS and the CMs is done via DOCSIS. Here is the reference I found with insight into DOCSIS.
DOCSIS® 3.1 – An Overview
Something I picked up is that CableLabs does a lot of the research for these systems. Other concepts to know include wavelength-division multiplexing (WDM), which was used in the traditional coax networks. The following explanation is an example of WDM in fiber.
Next, we get into the 7-layer OSI model. The example given for the physical layer is SONET technology. Another foray into T1 technology reveals the fact that bipolar transmission is used for T1 since it is more power efficient.
Multiplexing is the next interesting topic introduced. I have included some videos below on the different types of multiplexing employed in communications.
FDM involves modulating message signals over carrier frequencies then using bandpass filters to extract the individual signals.
The course also addresses transmission fundamentals like the difference between bit rate and baud rate, the Shannon–Hartley theorem, the Nyquist–Shannon sampling theorem, modulation, modems, and codecs. I have compiled a few videos covering these topics below.
Here is an explanation of the Shannon–Hartley theorem:
Channel Capacity by Shannon-Hartley | Basics, Proof & Maximum Bandwidth Condition
We then start getting into network addressing. One of the important concepts here is how the exhaustion of IPv4 addresses is handled: private IP addresses, DHCP, subnetting, and IPv6. One particularly interesting point was the difference between IPv4 and IPv6 headers:
In a discussion of the impact of TCP on throughput, the professor called out TCP global synchronization as an issue that networks need to avoid. Here’s one video about it.
Avoiding packet reordering is another important aspect of TCP. The contrast with UDP is especially interesting when other protocols like Google’s QUIC are designed. The RTP protocol (a relative of UDP, informally speaking) is used for VoIP. This is a good description of RTP:
I mentioned in my last post (Learning about Large Language Models) that I recently started going through Sebastian Raschka’s Build a Large Language Model from Scratch book. It had been a while since I ran python code on my laptop so I needed to do some cleanup to restore my environment. I cloned the repo and started executing the first cell in Chapter 2:
from importlib.metadata import version

print("torch version:", version("torch"))
print("tiktoken version:", version("tiktoken"))
I got this error: PackageNotFoundError: No package metadata was found for torch".
{
	"name": "PackageNotFoundError",
	"message": "No package metadata was found for torch",
	"stack": "---------------------------------------------------------------------------
StopIteration                             Traceback (most recent call last)
File /opt/homebrew/Cellar/python@3.11/3.11.1/Frameworks/Python.framework/Versions/3.11/lib/python3.11/importlib/metadata/__init__.py:563, in Distribution.from_name(cls, name)
    562 try:
--> 563     return next(cls.discover(name=name))
    564 except StopIteration:

StopIteration:

During handling of the above exception, another exception occurred:

PackageNotFoundError                      Traceback (most recent call last)
Cell In[2], line 7
      3 print(sys.version)
      5 from importlib.metadata import version
----> 7 print(\"torch version:\", version(\"torch\"))
      8 print(\"tiktoken version:\", version(\"tiktoken\"))

File /opt/homebrew/Cellar/python@3.11/3.11.1/Frameworks/Python.framework/Versions/3.11/lib/python3.11/importlib/metadata/__init__.py:1008, in version(distribution_name)
   1001 def version(distribution_name):
   1002     \"\"\"Get the version string for the named package.
   1003
   1004     :param distribution_name: The name of the distribution package to query.
   1005     :return: The version string for the package as defined in the package's
   1006         \"Version\" metadata key.
   1007     \"\"\"
-> 1008     return distribution(distribution_name).version

File /opt/homebrew/Cellar/python@3.11/3.11.1/Frameworks/Python.framework/Versions/3.11/lib/python3.11/importlib/metadata/__init__.py:981, in distribution(distribution_name)
    975 def distribution(distribution_name):
    976     \"\"\"Get the ``Distribution`` instance for the named package.
    977
    978     :param distribution_name: The name of the distribution package as a string.
    979     :return: A ``Distribution`` instance (or subclass thereof).
    980     \"\"\"
--> 981     return Distribution.from_name(distribution_name)

File /opt/homebrew/Cellar/python@3.11/3.11.1/Frameworks/Python.framework/Versions/3.11/lib/python3.11/importlib/metadata/__init__.py:565, in Distribution.from_name(cls, name)
    563     return next(cls.discover(name=name))
    564 except StopIteration:
--> 565     raise PackageNotFoundError(name)

PackageNotFoundError: No package metadata was found for torch"
}
How is this showing version 3.10.9 but VS Code is using 3.11 from brew (per the file paths in the error messages? This is how to print the version from a python script as per Printing Python version in output – Stack Overflow
Since I have brew installed, this might be what I need: the comment that “If you brew-install Python, but pip is still not in your path, you might need to re-link, like this brew unlink python && brew link python” at python – How do I install pip on macOS or OS X? – Stack Overflow.
saint@MacBookPro LLMs-from-scratch % brew update
==> Downloading https://ghcr.io/v2/homebrew/portable-ruby/portable-ruby/blobs/sha256:d9faa506c014dedc0b034a68103ba75c9a58242f4d6c67b6ca0f649c39602bcf
######################################################################################################################################################################################################################################### 100.0%
==> Pouring portable-ruby-3.3.7.arm64_big_sur.bottle.tar.gz
==> Homebrew collects anonymous analytics.
Read the analytics documentation (and how to opt-out) here:
  https://docs.brew.sh/Analytics
No analytics have been recorded yet (nor will be during this `brew` run).

==> homebrew/core is old and unneeded, untapping to save space...
Untapping homebrew/core...
Untapped 3 commands and 7398 formulae (7,130 files, 1GB).
==> homebrew/cask is old and unneeded, untapping to save space...
Untapping homebrew/cask...
Untapped 7333 casks (4,415 files, 487.2MB).
==> Downloading https://formulae.brew.sh/api/formula_tap_migrations.jws.json
Updated 4 taps (microsoft/git, homebrew/cask-versions, homebrew/core and homebrew/cask).
==> New Formulae

...<hundreds of lines omitted but included python entries below>

python-argcomplete
python-freethreading
python-gdbm@3.12
python-gdbm@3.13
python-matplotlib
python-packaging
python-setuptools
python-tk@3.12
python-tk@3.13
python@3.12
python@3.13
pyupgrade
...

==> Deleted Installed Formulae
icu4c ✘
==> Deleted Installed Casks
git-credential-manager-core ✘                                                                                            microsoft-openjdk11 ✘
Error: Unexpected method 'appcast' called on Cask adoptopenjdk16.
Follow the instructions here:
  https://github.com/Homebrew/homebrew-cask#reporting-bugs
==> Downloading https://formulae.brew.sh/api/cask_tap_migrations.jws.json
==> Outdated Formulae
aom                 fb303               fribidi             gnuplot             jasper              libheif             libtool             lua                 openblas            pstoedit            sqlite              xorgproto
arpack              fbthrift            gcc                 graphicsmagick      jbig2dec            libidn              libunistring        lz4                 openexr             pyqt@5              suite-sparse        xz
autoconf            fig2dev             gd                  harfbuzz            jpeg-turbo          libidn2             libvmaf             maven               openjdk             python@3.10         sundials            zstd
boost               fizz                gdbm                hdf5                jpeg-xl             liblqr              libx11              mpdecimal           openjpeg            python@3.11         tcl-tk
brotli              flac                gettext             highway             libaec              libomp              libxau              mpfr                openssl@1.1         python@3.9          texinfo
ca-certificates     fltk                ghostscript         hwloc               libavif             libpng              libxcb              mpg123              openssl@3           qscintilla2         wangle
cairo               fmt                 giflib              icu4c@76            libcerf             libraw              libxdmcp            netpbm              opus                qt@5                watchman
cmake               folly               git-gui             imagemagick         libde265            libsndfile          libxext             ninja               pango               readline            webp
double-conversion   fontconfig          glib                imath               libevent            libsodium           libxrender          octave              pcre2               shared-mime-info    wget
edencommon          freetype            gmp                 isl                 libffi              libtiff             little-cms2         open-mpi            pixman              snappy              x265
==> Outdated Casks
git-credential-manager                                                          microsoft-openjdk                                                               microsoft-openjdk@11

You have 113 outdated formulae and 3 outdated casks installed.
You can upgrade them with brew upgrade
or list them with brew outdated.
Error: Unexpected method 'appcast' called on Cask adoptopenjdk16.
Follow the instructions here:
  https://github.com/Homebrew/homebrew-cask#reporting-bugs
==> Migrating cask git-credential-manager-core to git-credential-manager
Error: inreplace failed
/opt/homebrew/Caskroom/git-credential-manager/.metadata/2.1.2/20230703191748.675/Casks/git-credential-manager.rb:
  expected replacement of /\A\s*cask\s+"git\-credential\-manager\-core"/ with "cask \"git-credential-manager\""
python3 --version is still 3.10.9 after this. I tried running pip but zsh sayd command not found. Unfortunately, linking or unlinking of either python or python3 fails with the errors below (despite ls -l `which python3` showing the same path as before).
saint@MacBookPro LLMs-from-scratch % brew unlink python3
Error: Unexpected method 'appcast' called on Cask adoptopenjdk16.
Follow the instructions here:
  https://github.com/Homebrew/homebrew-cask#reporting-bugs
Error: No such keg: /opt/homebrew/Cellar/python3
I decided to install python3 again.
saint@MacBookPro LLMs-from-scratch % brew install python3
==> Downloading https://formulae.brew.sh/api/formula.jws.json
==> Downloading https://formulae.brew.sh/api/cask.jws.json
==> Downloading https://ghcr.io/v2/homebrew/core/python/3.13/manifests/3.13.1
######################################################################################################################################################################################################################################### 100.0%
==> Fetching dependencies for python@3.13: mpdecimal, ca-certificates, openssl@3, readline, sqlite and xz
==> Downloading https://ghcr.io/v2/homebrew/core/mpdecimal/manifests/4.0.0-1
######################################################################################################################################################################################################################################### 100.0%
==> Fetching mpdecimal
==> Downloading https://ghcr.io/v2/homebrew/core/mpdecimal/blobs/sha256:0f5f269bed0e6be2de3edfc4b52867e656f993e5bcff40717f26ee94dd0d2211
######################################################################################################################################################################################################################################### 100.0%
==> Downloading https://ghcr.io/v2/homebrew/core/ca-certificates/manifests/2024-12-31
######################################################################################################################################################################################################################################### 100.0%
==> Fetching ca-certificates
...
<lots of omitted lines>
...
==> Fetching harfbuzz
==> Downloading https://ghcr.io/v2/homebrew/core/harfbuzz/blobs/sha256:2f892566c02b3c8c61aed6f7867b4405e5c814df8500ef4bc4ca91a9e40205a9
######################################################################################################################################################################################################################################### 100.0%
==> Fetching openjdk
==> Downloading https://ghcr.io/v2/homebrew/core/openjdk/blobs/sha256:1285eadf2b5998cda49e4470ee3875e855b0be199765401ad77dc38aea573f49
######################################################################################################################################################################################################################################### 100.0%
Error: can't modify frozen String: "The bottle needs the Xcode Command Line Tools to be installed at /Library/Developer/CommandLineTools.\nDevelopment tools provided by Xcode.app are not sufficient.\n\nYou can install the Xcode Command Line Tools, if desired, with:\n    xcode-select --install\n"
This was the new state of affairs is that command (failed):
saint@MacBookPro LLMs-from-scratch % python3 --version
Python 3.13.1
saint@MacBookPro LLMs-from-scratch % which python3
/opt/homebrew/bin/python3
saint@MacBookPro LLMs-from-scratch % ls -l `which python3`
lrwxr-xr-x  1 saint  admin  40 Feb  4 17:02 /opt/homebrew/bin/python3 -> ../Cellar/python@3.13/3.13.1/bin/python3
saint@MacBookPro LLMs-from-scratch % which pip
pip not found
Ah, all that agonizing and look at this – did I need to be using pip3 all this time?
saint@MacBookPro LLMs-from-scratch % which pip3
/opt/homebrew/bin/pip3
saint@MacBookPro LLMs-from-scratch % ls -l `which pip3`
lrwxr-xr-x  1 saint  admin  37 Feb  4 17:02 /opt/homebrew/bin/pip3 -> ../Cellar/python@3.13/3.13.1/bin/pip3
saint@MacBookPro LLMs-from-scratch %
Interestingly, I still can’t install pytorch using pip3?
saint@MacBookPro LLMs-from-scratch % pip3 install pytorch

[notice] A new release of pip is available: 24.3.1 -> 25.0
[notice] To update, run: python3.13 -m pip install --upgrade pip
error: externally-managed-environment

× This environment is externally managed
╰─> To install Python packages system-wide, try brew install
    xyz, where xyz is the package you are trying to
    install.

    If you wish to install a Python library that isn't in Homebrew,
    use a virtual environment:

    python3 -m venv path/to/venv
    source path/to/venv/bin/activate
    python3 -m pip install xyz

    If you wish to install a Python application that isn't in Homebrew,
    it may be easiest to use 'pipx install xyz', which will manage a
    virtual environment for you. You can install pipx with

    brew install pipx

    You may restore the old behavior of pip by passing
    the '--break-system-packages' flag to pip, or by adding
    'break-system-packages = true' to your pip.conf file. The latter
    will permanently disable this error.

    If you disable this error, we STRONGLY recommend that you additionally
    pass the '--user' flag to pip, or set 'user = true' in your pip.conf
    file. Failure to do this can result in a broken Homebrew installation.

    Read more about this behavior here: <https://peps.python.org/pep-0668/>

note: If you believe this is a mistake, please contact your Python installation or OS distribution provider. You can override this, at the risk of breaking your Python installation or OS, by passing --break-system-packages.
hint: See PEP 668 for the detailed specification.
saint@MacBookPro LLMs-from-scratch % xcode-select --install
xcode-select: note: install requested for command line developer tools
I installed the command line developer tools when prompted below.
Trying to run the first cell in VS Code with the updated setup now gave this error:
{
	"name": "",
	"message": "",
	"stack": "Running cells with 'Python 3.13.1' requires the ipykernel package.
Run the following command to install 'ipykernel' into the Python environment.
Command: '/opt/homebrew/bin/python3 -m pip install ipykernel -U --user --force-reinstall'"
}
saint@MacBookPro LLMs-from-scratch % /opt/homebrew/bin/python3 -m pip install ipykernel -U --user --force-reinstall

[notice] A new release of pip is available: 24.3.1 -> 25.0
[notice] To update, run: python3.13 -m pip install --upgrade pip
error: externally-managed-environment

× This environment is externally managed
╰─> To install Python packages system-wide, try brew install
    xyz, where xyz is the package you are trying to
    install.

    If you wish to install a Python library that isn't in Homebrew,
    use a virtual environment:

    python3 -m venv path/to/venv
    source path/to/venv/bin/activate
    python3 -m pip install xyz

    If you wish to install a Python application that isn't in Homebrew,
    it may be easiest to use 'pipx install xyz', which will manage a
    virtual environment for you. You can install pipx with

    brew install pipx

    You may restore the old behavior of pip by passing
    the '--break-system-packages' flag to pip, or by adding
    'break-system-packages = true' to your pip.conf file. The latter
    will permanently disable this error.

    If you disable this error, we STRONGLY recommend that you additionally
    pass the '--user' flag to pip, or set 'user = true' in your pip.conf
    file. Failure to do this can result in a broken Homebrew installation.

    Read more about this behavior here: <https://peps.python.org/pep-0668/>

note: If you believe this is a mistake, please contact your Python installation or OS distribution provider. You can override this, at the risk of breaking your Python installation or OS, by passing --break-system-packages.
hint: See PEP 668 for the detailed specification.
saint@MacBookPro LLMs-from-scratch % brew install ipykernel
==> Downloading https://formulae.brew.sh/api/formula.jws.json
==> Downloading https://formulae.brew.sh/api/cask.jws.json
Warning: No available formula with the name "ipykernel".
==> Searching for similarly named formulae and casks...
Error: No formulae or casks found for ipykernel.
I override the warning using the --break-system-packages flag and the VS Code notebook now runs.
saint@MacBookPro LLMs-from-scratch % python3 -m pip install ipykernel -U --user --force-reinstall --break-system-package
Collecting ipykernel
  Downloading ipykernel-6.29.5-py3-none-any.whl.metadata (6.3 kB)
Collecting appnope (from ipykernel)
  Downloading appnope-0.1.4-py2.py3-none-any.whl.metadata (908 bytes)
Collecting comm>=0.1.1 (from ipykernel)
  Downloading comm-0.2.2-py3-none-any.whl.metadata (3.7 kB)
Collecting debugpy>=1.6.5 (from ipykernel)
  Downloading debugpy-1.8.12-cp313-cp313-macosx_14_0_universal2.whl.metadata (1.3 kB)
Collecting ipython>=7.23.1 (from ipykernel)
  Downloading ipython-8.32.0-py3-none-any.whl.metadata (5.0 kB)
Collecting jupyter-client>=6.1.12 (from ipykernel)
  Downloading jupyter_client-8.6.3-py3-none-any.whl.metadata (8.3 kB)
Collecting jupyter-core!=5.0.*,>=4.12 (from ipykernel)
  Downloading jupyter_core-5.7.2-py3-none-any.whl.metadata (3.4 kB)
Collecting matplotlib-inline>=0.1 (from ipykernel)
  Downloading matplotlib_inline-0.1.7-py3-none-any.whl.metadata (3.9 kB)
Collecting nest-asyncio (from ipykernel)
  Downloading nest_asyncio-1.6.0-py3-none-any.whl.metadata (2.8 kB)
Collecting packaging (from ipykernel)
  Downloading packaging-24.2-py3-none-any.whl.metadata (3.2 kB)
Collecting psutil (from ipykernel)
  Downloading psutil-6.1.1-cp36-abi3-macosx_11_0_arm64.whl.metadata (22 kB)
Collecting pyzmq>=24 (from ipykernel)
  Downloading pyzmq-26.2.1-cp313-cp313-macosx_10_15_universal2.whl.metadata (6.2 kB)
Collecting tornado>=6.1 (from ipykernel)
  Downloading tornado-6.4.2-cp38-abi3-macosx_10_9_universal2.whl.metadata (2.5 kB)
Collecting traitlets>=5.4.0 (from ipykernel)
  Downloading traitlets-5.14.3-py3-none-any.whl.metadata (10 kB)
Collecting decorator (from ipython>=7.23.1->ipykernel)
  Downloading decorator-5.1.1-py3-none-any.whl.metadata (4.0 kB)
Collecting jedi>=0.16 (from ipython>=7.23.1->ipykernel)
  Downloading jedi-0.19.2-py2.py3-none-any.whl.metadata (22 kB)
Collecting pexpect>4.3 (from ipython>=7.23.1->ipykernel)
  Downloading pexpect-4.9.0-py2.py3-none-any.whl.metadata (2.5 kB)
Collecting prompt_toolkit<3.1.0,>=3.0.41 (from ipython>=7.23.1->ipykernel)
  Downloading prompt_toolkit-3.0.50-py3-none-any.whl.metadata (6.6 kB)
Collecting pygments>=2.4.0 (from ipython>=7.23.1->ipykernel)
  Downloading pygments-2.19.1-py3-none-any.whl.metadata (2.5 kB)
Collecting stack_data (from ipython>=7.23.1->ipykernel)
  Downloading stack_data-0.6.3-py3-none-any.whl.metadata (18 kB)
Collecting python-dateutil>=2.8.2 (from jupyter-client>=6.1.12->ipykernel)
  Downloading python_dateutil-2.9.0.post0-py2.py3-none-any.whl.metadata (8.4 kB)
Collecting platformdirs>=2.5 (from jupyter-core!=5.0.*,>=4.12->ipykernel)
  Downloading platformdirs-4.3.6-py3-none-any.whl.metadata (11 kB)
Collecting parso<0.9.0,>=0.8.4 (from jedi>=0.16->ipython>=7.23.1->ipykernel)
  Downloading parso-0.8.4-py2.py3-none-any.whl.metadata (7.7 kB)
Collecting ptyprocess>=0.5 (from pexpect>4.3->ipython>=7.23.1->ipykernel)
  Downloading ptyprocess-0.7.0-py2.py3-none-any.whl.metadata (1.3 kB)
Collecting wcwidth (from prompt_toolkit<3.1.0,>=3.0.41->ipython>=7.23.1->ipykernel)
  Downloading wcwidth-0.2.13-py2.py3-none-any.whl.metadata (14 kB)
Collecting six>=1.5 (from python-dateutil>=2.8.2->jupyter-client>=6.1.12->ipykernel)
  Downloading six-1.17.0-py2.py3-none-any.whl.metadata (1.7 kB)
Collecting executing>=1.2.0 (from stack_data->ipython>=7.23.1->ipykernel)
  Downloading executing-2.2.0-py2.py3-none-any.whl.metadata (8.9 kB)
Collecting asttokens>=2.1.0 (from stack_data->ipython>=7.23.1->ipykernel)
  Downloading asttokens-3.0.0-py3-none-any.whl.metadata (4.7 kB)
Collecting pure-eval (from stack_data->ipython>=7.23.1->ipykernel)
  Downloading pure_eval-0.2.3-py3-none-any.whl.metadata (6.3 kB)
Downloading ipykernel-6.29.5-py3-none-any.whl (117 kB)
Downloading comm-0.2.2-py3-none-any.whl (7.2 kB)
Downloading debugpy-1.8.12-cp313-cp313-macosx_14_0_universal2.whl (2.5 MB)
   ━━━━━━━━━━━━━━━━━━━━━━━━━━━━━━━━━━━━━━━━ 2.5/2.5 MB 36.8 MB/s eta 0:00:00
Downloading ipython-8.32.0-py3-none-any.whl (825 kB)
   ━━━━━━━━━━━━━━━━━━━━━━━━━━━━━━━━━━━━━━━━ 825.5/825.5 kB 54.9 MB/s eta 0:00:00
Downloading jupyter_client-8.6.3-py3-none-any.whl (106 kB)
Downloading jupyter_core-5.7.2-py3-none-any.whl (28 kB)
Downloading matplotlib_inline-0.1.7-py3-none-any.whl (9.9 kB)
Downloading pyzmq-26.2.1-cp313-cp313-macosx_10_15_universal2.whl (1.3 MB)
   ━━━━━━━━━━━━━━━━━━━━━━━━━━━━━━━━━━━━━━━━ 1.3/1.3 MB 62.7 MB/s eta 0:00:00
Downloading tornado-6.4.2-cp38-abi3-macosx_10_9_universal2.whl (436 kB)
Downloading traitlets-5.14.3-py3-none-any.whl (85 kB)
Downloading appnope-0.1.4-py2.py3-none-any.whl (4.3 kB)
Downloading nest_asyncio-1.6.0-py3-none-any.whl (5.2 kB)
Downloading packaging-24.2-py3-none-any.whl (65 kB)
Downloading psutil-6.1.1-cp36-abi3-macosx_11_0_arm64.whl (248 kB)
Downloading jedi-0.19.2-py2.py3-none-any.whl (1.6 MB)
   ━━━━━━━━━━━━━━━━━━━━━━━━━━━━━━━━━━━━━━━━ 1.6/1.6 MB 79.1 MB/s eta 0:00:00
Downloading pexpect-4.9.0-py2.py3-none-any.whl (63 kB)
Downloading platformdirs-4.3.6-py3-none-any.whl (18 kB)
Downloading prompt_toolkit-3.0.50-py3-none-any.whl (387 kB)
Downloading pygments-2.19.1-py3-none-any.whl (1.2 MB)
   ━━━━━━━━━━━━━━━━━━━━━━━━━━━━━━━━━━━━━━━━ 1.2/1.2 MB 58.1 MB/s eta 0:00:00
Downloading python_dateutil-2.9.0.post0-py2.py3-none-any.whl (229 kB)
Downloading decorator-5.1.1-py3-none-any.whl (9.1 kB)
Downloading stack_data-0.6.3-py3-none-any.whl (24 kB)
Downloading asttokens-3.0.0-py3-none-any.whl (26 kB)
Downloading executing-2.2.0-py2.py3-none-any.whl (26 kB)
Downloading parso-0.8.4-py2.py3-none-any.whl (103 kB)
Downloading ptyprocess-0.7.0-py2.py3-none-any.whl (13 kB)
Downloading six-1.17.0-py2.py3-none-any.whl (11 kB)
Downloading pure_eval-0.2.3-py3-none-any.whl (11 kB)
Downloading wcwidth-0.2.13-py2.py3-none-any.whl (34 kB)
Installing collected packages: wcwidth, pure-eval, ptyprocess, traitlets, tornado, six, pyzmq, pygments, psutil, prompt_toolkit, platformdirs, pexpect, parso, packaging, nest-asyncio, executing, decorator, debugpy, asttokens, appnope, stack_data, python-dateutil, matplotlib-inline, jupyter-core, jedi, comm, jupyter-client, ipython, ipykernel
  WARNING: The script pygmentize is installed in '/Users/saint/Library/Python/3.13/bin' which is not on PATH.
  Consider adding this directory to PATH or, if you prefer to suppress this warning, use --no-warn-script-location.
  WARNING: The script debugpy is installed in '/Users/saint/Library/Python/3.13/bin' which is not on PATH.
  Consider adding this directory to PATH or, if you prefer to suppress this warning, use --no-warn-script-location.
  WARNING: The scripts jupyter, jupyter-migrate and jupyter-troubleshoot are installed in '/Users/saint/Library/Python/3.13/bin' which is not on PATH.
  Consider adding this directory to PATH or, if you prefer to suppress this warning, use --no-warn-script-location.
  WARNING: The scripts jupyter-kernel, jupyter-kernelspec and jupyter-run are installed in '/Users/saint/Library/Python/3.13/bin' which is not on PATH.
  Consider adding this directory to PATH or, if you prefer to suppress this warning, use --no-warn-script-location.
  WARNING: The scripts ipython and ipython3 are installed in '/Users/saint/Library/Python/3.13/bin' which is not on PATH.
  Consider adding this directory to PATH or, if you prefer to suppress this warning, use --no-warn-script-location.
Successfully installed appnope-0.1.4 asttokens-3.0.0 comm-0.2.2 debugpy-1.8.12 decorator-5.1.1 executing-2.2.0 ipykernel-6.29.5 ipython-8.32.0 jedi-0.19.2 jupyter-client-8.6.3 jupyter-core-5.7.2 matplotlib-inline-0.1.7 nest-asyncio-1.6.0 packaging-24.2 parso-0.8.4 pexpect-4.9.0 platformdirs-4.3.6 prompt_toolkit-3.0.50 psutil-6.1.1 ptyprocess-0.7.0 pure-eval-0.2.3 pygments-2.19.1 python-dateutil-2.9.0.post0 pyzmq-26.2.1 six-1.17.0 stack_data-0.6.3 tornado-6.4.2 traitlets-5.14.3 wcwidth-0.2.13

[notice] A new release of pip is available: 24.3.1 -> 25.0
[notice] To update, run: python3.13 -m pip install --upgrade pip
saint@MacBookPro LLMs-from-scratch %
First cell now fails because the torch package cannot be found:
{
	"name": "PackageNotFoundError",
	"message": "No package metadata was found for torch",
	"stack": "---------------------------------------------------------------------------
StopIteration                             Traceback (most recent call last)
File /opt/homebrew/Cellar/python@3.13/3.13.1/Frameworks/Python.framework/Versions/3.13/lib/python3.13/importlib/metadata/__init__.py:407, in Distribution.from_name(cls, name)
    406 try:
--> 407     return next(iter(cls.discover(name=name)))
    408 except StopIteration:

StopIteration:

During handling of the above exception, another exception occurred:

PackageNotFoundError                      Traceback (most recent call last)
Cell In[1], line 3
      1 from importlib.metadata import version
----> 3 print(\"torch version:\", version(\"torch\"))
      4 print(\"tiktoken version:\", version(\"tiktoken\"))

File /opt/homebrew/Cellar/python@3.13/3.13.1/Frameworks/Python.framework/Versions/3.13/lib/python3.13/importlib/metadata/__init__.py:987, in version(distribution_name)
    980 def version(distribution_name: str) -> str:
    981     \"\"\"Get the version string for the named package.
    982
    983     :param distribution_name: The name of the distribution package to query.
    984     :return: The version string for the package as defined in the package's
    985         \"Version\" metadata key.
    986     \"\"\"
--> 987     return distribution(distribution_name).version

File /opt/homebrew/Cellar/python@3.13/3.13.1/Frameworks/Python.framework/Versions/3.13/lib/python3.13/importlib/metadata/__init__.py:960, in distribution(distribution_name)
    954 def distribution(distribution_name: str) -> Distribution:
    955     \"\"\"Get the ``Distribution`` instance for the named package.
    956
    957     :param distribution_name: The name of the distribution package as a string.
    958     :return: A ``Distribution`` instance (or subclass thereof).
    959     \"\"\"
--> 960     return Distribution.from_name(distribution_name)

File /opt/homebrew/Cellar/python@3.13/3.13.1/Frameworks/Python.framework/Versions/3.13/lib/python3.13/importlib/metadata/__init__.py:409, in Distribution.from_name(cls, name)
    407     return next(iter(cls.discover(name=name)))
    408 except StopIteration:
--> 409     raise PackageNotFoundError(name)

PackageNotFoundError: No package metadata was found for torch"
}
These are the commands I tried to install pytorch before finding the correct one: pip3 install torch --break-system-packages.
saint@MacBookPro LLMs-from-scratch % brew install torch
==> Downloading https://formulae.brew.sh/api/formula.jws.json
==> Downloading https://formulae.brew.sh/api/cask.jws.json
Warning: No available formula with the name "torch". Did you mean tor, pytorch or orc?
==> Searching for similarly named formulae and casks...
==> Formulae
pytorch ✔                                                    torchvision                                                  tor                                                          orc

To install pytorch ✔, run:
  brew install pytorch ✔
saint@MacBookPro LLMs-from-scratch % brew install pytorch
Warning: pytorch 2.5.1_4 is already installed and up-to-date.
To reinstall 2.5.1_4, run:
  brew reinstall pytorch
saint@MacBookPro LLMs-from-scratch % pip3 install torch

[notice] A new release of pip is available: 24.3.1 -> 25.0
[notice] To update, run: python3.13 -m pip install --upgrade pip
error: externally-managed-environment

× This environment is externally managed
╰─> To install Python packages system-wide, try brew install
    xyz, where xyz is the package you are trying to
    install.

    If you wish to install a Python library that isn't in Homebrew,
    use a virtual environment:

    python3 -m venv path/to/venv
    source path/to/venv/bin/activate
    python3 -m pip install xyz

    If you wish to install a Python application that isn't in Homebrew,
    it may be easiest to use 'pipx install xyz', which will manage a
    virtual environment for you. You can install pipx with

    brew install pipx

    You may restore the old behavior of pip by passing
    the '--break-system-packages' flag to pip, or by adding
    'break-system-packages = true' to your pip.conf file. The latter
    will permanently disable this error.

    If you disable this error, we STRONGLY recommend that you additionally
    pass the '--user' flag to pip, or set 'user = true' in your pip.conf
    file. Failure to do this can result in a broken Homebrew installation.

    Read more about this behavior here: <https://peps.python.org/pep-0668/>

note: If you believe this is a mistake, please contact your Python installation or OS distribution provider. You can override this, at the risk of breaking your Python installation or OS, by passing --break-system-packages.
hint: See PEP 668 for the detailed specification.
saint@MacBookPro LLMs-from-scratch %
saint@MacBookPro LLMs-from-scratch % pip3 install torch --break-system-packages
Collecting torch
  Downloading torch-2.6.0-cp313-none-macosx_11_0_arm64.whl.metadata (28 kB)
Collecting filelock (from torch)
  Downloading filelock-3.17.0-py3-none-any.whl.metadata (2.9 kB)
Collecting typing-extensions>=4.10.0 (from torch)
  Downloading typing_extensions-4.12.2-py3-none-any.whl.metadata (3.0 kB)
Collecting networkx (from torch)
  Downloading networkx-3.4.2-py3-none-any.whl.metadata (6.3 kB)
Collecting jinja2 (from torch)
  Downloading jinja2-3.1.5-py3-none-any.whl.metadata (2.6 kB)
Collecting fsspec (from torch)
  Downloading fsspec-2025.2.0-py3-none-any.whl.metadata (11 kB)
Collecting setuptools (from torch)
  Downloading setuptools-75.8.0-py3-none-any.whl.metadata (6.7 kB)
Collecting sympy==1.13.1 (from torch)
  Downloading sympy-1.13.1-py3-none-any.whl.metadata (12 kB)
Collecting mpmath<1.4,>=1.1.0 (from sympy==1.13.1->torch)
  Downloading mpmath-1.3.0-py3-none-any.whl.metadata (8.6 kB)
Collecting MarkupSafe>=2.0 (from jinja2->torch)
  Downloading MarkupSafe-3.0.2-cp313-cp313-macosx_11_0_arm64.whl.metadata (4.0 kB)
Downloading torch-2.6.0-cp313-none-macosx_11_0_arm64.whl (66.5 MB)
   ━━━━━━━━━━━━━━━━━━━━━━━━━━━━━━━━━━━━━━━━ 66.5/66.5 MB 74.3 MB/s eta 0:00:00
Downloading sympy-1.13.1-py3-none-any.whl (6.2 MB)
   ━━━━━━━━━━━━━━━━━━━━━━━━━━━━━━━━━━━━━━━━ 6.2/6.2 MB 75.0 MB/s eta 0:00:00
Downloading typing_extensions-4.12.2-py3-none-any.whl (37 kB)
Downloading filelock-3.17.0-py3-none-any.whl (16 kB)
Downloading fsspec-2025.2.0-py3-none-any.whl (184 kB)
Downloading jinja2-3.1.5-py3-none-any.whl (134 kB)
Downloading networkx-3.4.2-py3-none-any.whl (1.7 MB)
   ━━━━━━━━━━━━━━━━━━━━━━━━━━━━━━━━━━━━━━━━ 1.7/1.7 MB 63.7 MB/s eta 0:00:00
Downloading setuptools-75.8.0-py3-none-any.whl (1.2 MB)
   ━━━━━━━━━━━━━━━━━━━━━━━━━━━━━━━━━━━━━━━━ 1.2/1.2 MB 37.0 MB/s eta 0:00:00
Downloading MarkupSafe-3.0.2-cp313-cp313-macosx_11_0_arm64.whl (12 kB)
Downloading mpmath-1.3.0-py3-none-any.whl (536 kB)
   ━━━━━━━━━━━━━━━━━━━━━━━━━━━━━━━━━━━━━━━━ 536.2/536.2 kB 27.9 MB/s eta 0:00:00
Installing collected packages: mpmath, typing-extensions, sympy, setuptools, networkx, MarkupSafe, fsspec, filelock, jinja2, torch
Successfully installed MarkupSafe-3.0.2 filelock-3.17.0 fsspec-2025.2.0 jinja2-3.1.5 mpmath-1.3.0 networkx-3.4.2 setuptools-75.8.0 sympy-1.13.1 torch-2.6.0 typing-extensions-4.12.2

[notice] A new release of pip is available: 24.3.1 -> 25.0
[notice] To update, run: python3.13 -m pip install --upgrade pip
saint@MacBookPro LLMs-from-scratch %
The pytorch import finally works! The next error is also a PackageNotFoundError: "No package metadata was found for tiktoken" which I addressed with the same installation steps:
saint@MacBookPro LLMs-from-scratch % pip3 install tiktoken

[notice] A new release of pip is available: 24.3.1 -> 25.0
[notice] To update, run: python3.13 -m pip install --upgrade pip
error: externally-managed-environment

× This environment is externally managed
╰─> To install Python packages system-wide, try brew install
    xyz, where xyz is the package you are trying to
    install.

    If you wish to install a Python library that isn't in Homebrew,
    use a virtual environment:

    python3 -m venv path/to/venv
    source path/to/venv/bin/activate
    python3 -m pip install xyz

    If you wish to install a Python application that isn't in Homebrew,
    it may be easiest to use 'pipx install xyz', which will manage a
    virtual environment for you. You can install pipx with

    brew install pipx

    You may restore the old behavior of pip by passing
    the '--break-system-packages' flag to pip, or by adding
    'break-system-packages = true' to your pip.conf file. The latter
    will permanently disable this error.

    If you disable this error, we STRONGLY recommend that you additionally
    pass the '--user' flag to pip, or set 'user = true' in your pip.conf
    file. Failure to do this can result in a broken Homebrew installation.

    Read more about this behavior here: <https://peps.python.org/pep-0668/>

note: If you believe this is a mistake, please contact your Python installation or OS distribution provider. You can override this, at the risk of breaking your Python installation or OS, by passing --break-system-packages.
hint: See PEP 668 for the detailed specification.
saint@MacBookPro LLMs-from-scratch %
saint@MacBookPro LLMs-from-scratch % pip3 install tiktoken --break-system-packages
Collecting tiktoken
  Downloading tiktoken-0.8.0-cp313-cp313-macosx_11_0_arm64.whl.metadata (6.6 kB)
Collecting regex>=2022.1.18 (from tiktoken)
  Downloading regex-2024.11.6-cp313-cp313-macosx_11_0_arm64.whl.metadata (40 kB)
Collecting requests>=2.26.0 (from tiktoken)
  Downloading requests-2.32.3-py3-none-any.whl.metadata (4.6 kB)
Collecting charset-normalizer<4,>=2 (from requests>=2.26.0->tiktoken)
  Downloading charset_normalizer-3.4.1-cp313-cp313-macosx_10_13_universal2.whl.metadata (35 kB)
Collecting idna<4,>=2.5 (from requests>=2.26.0->tiktoken)
  Downloading idna-3.10-py3-none-any.whl.metadata (10 kB)
Collecting urllib3<3,>=1.21.1 (from requests>=2.26.0->tiktoken)
  Downloading urllib3-2.3.0-py3-none-any.whl.metadata (6.5 kB)
Collecting certifi>=2017.4.17 (from requests>=2.26.0->tiktoken)
  Downloading certifi-2025.1.31-py3-none-any.whl.metadata (2.5 kB)
Downloading tiktoken-0.8.0-cp313-cp313-macosx_11_0_arm64.whl (982 kB)
   ━━━━━━━━━━━━━━━━━━━━━━━━━━━━━━━━━━━━━━━━ 982.8/982.8 kB 24.2 MB/s eta 0:00:00
Downloading regex-2024.11.6-cp313-cp313-macosx_11_0_arm64.whl (284 kB)
Downloading requests-2.32.3-py3-none-any.whl (64 kB)
Downloading certifi-2025.1.31-py3-none-any.whl (166 kB)
Downloading charset_normalizer-3.4.1-cp313-cp313-macosx_10_13_universal2.whl (195 kB)
Downloading idna-3.10-py3-none-any.whl (70 kB)
Downloading urllib3-2.3.0-py3-none-any.whl (128 kB)
Installing collected packages: urllib3, regex, idna, charset-normalizer, certifi, requests, tiktoken
Successfully installed certifi-2025.1.31 charset-normalizer-3.4.1 idna-3.10 regex-2024.11.6 requests-2.32.3 tiktoken-0.8.0 urllib3-2.3.0

[notice] A new release of pip is available: 24.3.1 -> 25.0
[notice] To update, run: python3.13 -m pip install --upgrade pip
saint@MacBookPro LLMs-from-scratch %
Finally, my machine is in a state that can run the code in the Jupyter notebook! This is such a brittle environment. I need to switch to a managed environment to avoid this type of mess.
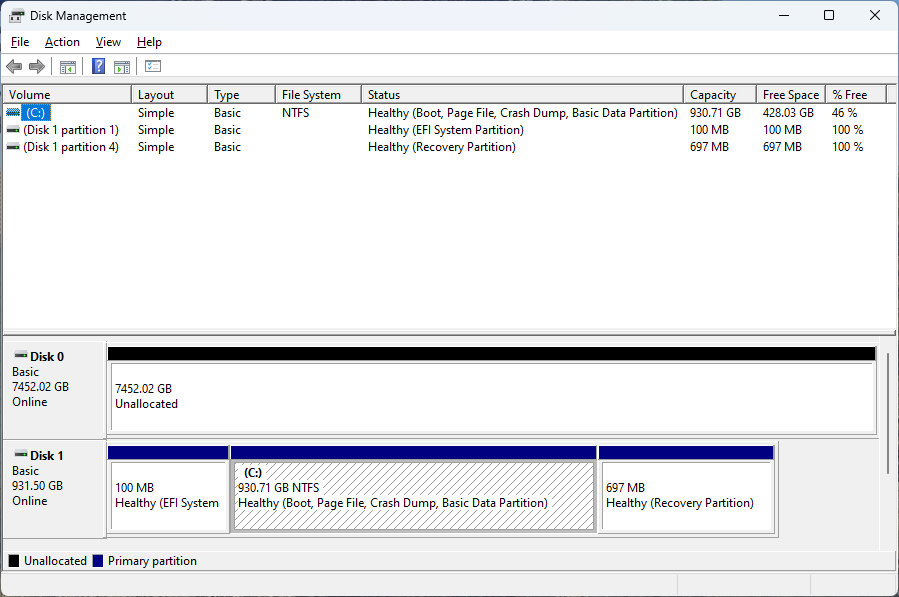
These shortcomings aside, the ASRock > B550M-C motherboard in that desktop had more than enough SATA ports. I mounted the hard disk in my HPZ4 desktop (now there’s a well-designed case) and plugged one of the HP case power connectors to it. I then connected the SATA cable from the hard disk to my Skytech motherboard. Talk about a cowboy setup. Here’s the Disk Management view after starting Windows.
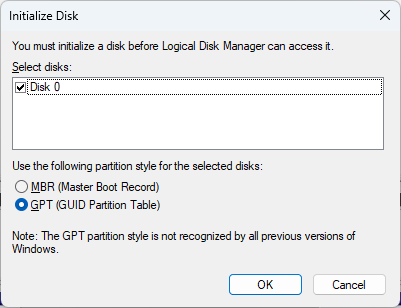
I use the “New Simple Volume” command to do an NTFS quick format on the 7630868 MB volume:
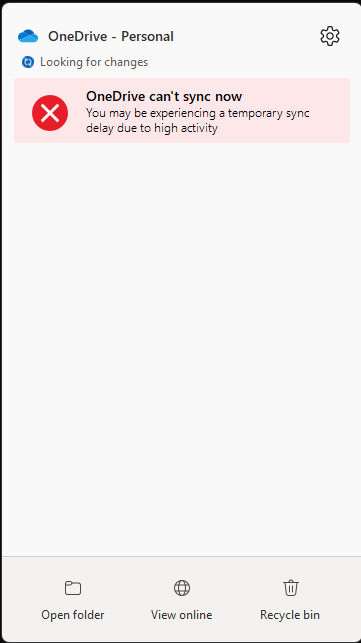
With my 8TB hard ddrive set up, I searched for how to move onedrive folder to different drive. This Microsoft Support result had directions on how to Change the location of your OneDrive folder. I set up OneDrive to download everything on OneDrive and to always keep the files locally. I disabled sleep mode on my desktop to let OneDrive download continuously. After downloading 896.5GB, I got this error.
Syncing did not resume until later the next day (it had been over 24hours by the time I tried again). It had never crossed my mind that there are such limits for these services – I just expect them to be available when I needed them, which is another reason to have a local copy of everything I have in the cloud. In the process of setting all this up, I realized that 200GB of the videos I had on OneDrive didn’t really need to be there, so I was able to free up enough space to meet my needs for some time into the foreseeable future.
I have seen many platforms playing multiple videos where the presenter and their screen are separate streams but they are kept in sync. Native HTML5 video support was relatively new when I last worked on web development so I decided to experiment with multiple videos in an HTML5 document. Here is the basic HTML page:
I ran this through the W3C Markup Validation Service and this snippet passed the check. My initial attempt closed the video tag using the <video ... /> style. The validator complained that “Self-closing syntax (/>) used on a non-void HTML element.” A search engine led me to Mozilla’s Void element page.
A void element is an element in HTML that cannot have any child nodes (i.e., nested elements or text nodes). Void elements only have a start tag; end tags must not be specified for void elements.
This means that non-void elements should have a closing tag. It’s also strange to me that the controls attribute is required to show controls but I guess it makes sense to let that be, well, controllable.
To synchronize the videos, we need to ensure that playing one video results in the other playing as well. Likewise for pausing, seeking, and changing the playback speed. My first attempt at this was to add JavaScript to the head of the HTML document. I’m not using jQuery or any other libraries. Therefore, I ran into exceptions because the DOM wasn’t ready when my script was running. Vanilla JavaScript equivalent of jQuery’s $.ready() – how to call a function when the page/DOM is ready for it [duplicate] suggested putting the script after all the HTML elements. All this was once second nature to me back in the IE6 days but this suggestion is good enough for my experiment. The final page now looks like this (with links to the relevant events, properties, and methods):
<!DOCTYPE html>
<html lang="en">
<title>Two Video Synchronization Demo</title>
<body>
<!-- https://developer.mozilla.org/en-US/docs/Web/HTML/Element/video -->
<videocontrols id="video1" src="flower.mp4"></video>
<videocontrols id="video2" src="nature.mp4"></video>
<script>
const video1 = document.getElementById("video1");
const video2 = document.getElementById("video2");
// Handle the play event on each video to ensure that
// when one video is played the other plays as well.
video1.addEventListener("play", (event) => {
video2.play();
});
video2.addEventListener("play", (event) => {
video1.play();
});
// Handle the pause event on each video to ensure that
// when one video is paused the other is paused as well.
video1.addEventListener("pause", (event) => {
video2.pause();
});
video2.addEventListener("pause", (event) => {
video1.pause();
});
// Handle the ratechange event on each video to ensure that
// when the playback rate of one video is changed,
// the other is set to use the same rate.
video1.addEventListener("ratechange", (event) => {
video2.playbackRate = video1.playbackRate;
});
video2.addEventListener("ratechange", (event) => {
video1.playbackRate = video2.playbackRate;
});
// Handle the seek event on each video to ensure that
// when one video is seeked the other seeks to the same location.
video1.addEventListener("seeked", (event) => {
// Do not use fastSeek since we need precision.
if (video1.paused && video2.paused) {
video2.currentTime = video1.currentTime;
}
});
video2.addEventListener("seeked", (event) => {
if (video1.paused && video2.paused) {
video1.currentTime = video2.currentTime;
}
});
</script>
</body>
</html>
Notice that the last requirement on seeking is implemented slightly differently: I synchronized the current time in the videos only if they were both paused. This prevents weird behavior where the videos keep syncing to each other interrupting playback.
The last thing I wanted to do was lay out the videos so that one overlaps the other (in the top left or bottom right). I needed to add a style tag to the head of the document. I searched for how to put a div in the bottom right and the StackOverflow question How can I position my div at the bottom of its container? suggests absolute positioning in a container div. See the CSS in the final page below.
<!DOCTYPE html>
<html lang="en">
<title>Two Video Synchronization Demo</title>
<style>
#video-container {
position: relative;
}
#video1 {
width: 20%;
position:absolute;
top: 0px;
left: 0px;
}
#video2 {
width: 100%;
}
</style>
<body>
<div id="video-container">
<videocontrols id="video1" src="flower.mp4"></video>
<videocontrols id="video2" src="nature.mp4"></video>
</div>
<script>
const video1 = document.getElementById("video1");
const video2 = document.getElementById("video2");
// Handle the play event on each video to ensure that
// when one video is played the other plays as well.
video1.addEventListener("play", (event) => {
video2.play();
});
video2.addEventListener("play", (event) => {
video1.play();
});
// Handle the pause event on each video to ensure that
// when one video is paused the other is paused as well.
video1.addEventListener("pause", (event) => {
video2.pause();
});
video2.addEventListener("pause", (event) => {
video1.pause();
});
// Handle the ratechange event on each video to ensure that
// when the playback rate of one video is changed,
// the other is set to use the same rate.
video1.addEventListener("ratechange", (event) => {
video2.playbackRate = video1.playbackRate;
});
video2.addEventListener("ratechange", (event) => {
video1.playbackRate = video2.playbackRate;
});
// Handle the seek event on each video to ensure that
// when one video is seeked the other seeks to the same location.
video1.addEventListener("seeked", (event) => {
// Do not use fastSeek since we need precision.
if (video1.paused && video2.paused) {
video2.currentTime = video1.currentTime;
}
});
video2.addEventListener("seeked", (event) => {
if (video1.paused && video2.paused) {
video1.currentTime = video2.currentTime;
}
});
</script>
</body>
</html>
This was a useful HTML, JavaScript, and CSS refresher!
I want to evaluate the OpenJDK serial collector using a Java program I wrote to factorize natural numbers by trial division. This post is about how to set up the app to run in a Docker container on a Linux host. Since the host is a shared machine, I put all my work under ~/swesonga (my own custom home directory). The directory structure for the container will be under ~/swesonga/container/.
Set up the Factorization App
First, log into Linux machine and download the Java binaries to test:
ssh user@IPaddress
mkdir -p ~/swesonga/container/java/binaries/jdk/x64/
cd ~/swesonga/container/java/binaries/jdk/x64/

curl -Lo microsoft-jdk-21.0.5-linux-x64.tar.gz https://aka.ms/download-jdk/microsoft-jdk-21.0.5-linux-x64.tar.gz

tar xzf microsoft-jdk-21.0.5-linux-x64.tar.gz
cd ~/swesonga/container/
git clone https://github.com/swesonga/factorize

cd ~/swesonga/container/java
curl -Lo commons-cli-1.9.0-bin.tar.gz https://dlcdn.apache.org//commons/cli/binaries/commons-cli-1.9.0-bin.tar.gz
tar xzf commons-cli-1.9.0-bin.tar.gz
Verify that docker is up by running docker version. I got this output:
user@machine:~/swesonga$ docker version
Client: Docker Engine - Community
 Version:           23.0.1
 API version:       1.42
 Go version:        go1.19.5
 Git commit:        a5ee5b1
 Built:             Thu Feb  9 19:46:56 2023
 OS/Arch:           linux/amd64
 Context:           default
Cannot connect to the Docker daemon at unix:///var/run/docker.sock. Is the docker daemon running?
One error I ran into initially was that docker was unable to start the container process. I had missed the COPY command in the Dockerfile so the file couldn’t be found:
user@machine:~/swesonga$ docker run -i -t swesonga-jdk21-testapp
docker: Error response from daemon: failed to create shim task: OCI runtime create failed: runc create failed: unable to start container process: exec: "/home/<user>/swesonga/java/binaries/jdk/x64/jdk-21.0.5+11/bin/java": stat /home/<user>/swesonga/java/binaries/jdk/x64/jdk-21.0.5+11/bin/java: no such file or directory: unknown.
ERRO[0000] error waiting for container:
user@machine:~/swesonga$ docker system df
TYPE            TOTAL     ACTIVE    SIZE      RECLAIMABLE
Images          2         2         1.22GB    443.1MB (36%)
Containers      3         0         0B        0B
Local Volumes   0         0         0B        0B
Build Cache     9         0         776.9MB   776.9MB
user@machine:~/swesonga$ docker system df -v
Images space usage:

REPOSITORY               TAG       IMAGE ID       CREATED          SIZE      SHARED SIZE   UNIQUE SIZE   CONTAINERS
swesonga-jdk21-testapp   latest    682fedf54071   11 minutes ago   1.22GB    443.1MB       776.9MB       2
<none>                   <none>    4c068055cad5   26 minutes ago   443.1MB   443.1MB       0B            1

Containers space usage:

CONTAINER ID   IMAGE                    COMMAND                  LOCAL VOLUMES   SIZE      CREATED          STATUS    NAMES
c77b69082a8a   swesonga-jdk21-testapp   "/home/<user>/swesonga/…"   0               0B        6 minutes ago    Created   awesome_chatelet
58c723638dd2   swesonga-jdk21-testapp   "/home/<user>/swesonga/…"   0               0B        8 minutes ago    Created   sharp_lamport
4a3be55725b5   4c068055cad5             "/home/<user>/swesonga/…"   0               0B        17 minutes ago   Created   lucid_tharp

Local Volumes space usage:

VOLUME NAME   LINKS     SIZE

Build cache usage: 776.9MB
...
I tried pruning the build cache as suggested in that post.
user@machine:~/swesonga$ docker builder prune --all
WARNING! This will remove all build cache. Are you sure you want to continue? [y/N] y
ID                                              RECLAIMABLE     SIZE            LAST ACCESSED
te4o8rbj7s6nh6pluquzummzz                       true            0B              8 minutes ago
n2wbz4gf448fluw4uuogiqxdo*                      true    776.9MB         8 minutes ago
...
Total:  1.554GB
I realized that pruning wasn’t what I needed because now the cache was empty but the containers were still there based on the next output:
user@machine:~/swesonga$ docker system df -v
Images space usage:

REPOSITORY               TAG       IMAGE ID       CREATED          SIZE      SHARED SIZE   UNIQUE SIZE   CONTAINERS
swesonga-jdk21-testapp   latest    682fedf54071   18 minutes ago   1.22GB    443.1MB       776.9MB       2
<none>                   <none>    4c068055cad5   33 minutes ago   443.1MB   443.1MB       0B            1

Containers space usage:

CONTAINER ID   IMAGE                    COMMAND                  LOCAL VOLUMES   SIZE      CREATED          STATUS    NAMES
c77b69082a8a   swesonga-jdk21-testapp   "/home/<user>/swesonga/…"   0               0B        13 minutes ago   Created   awesome_chatelet
58c723638dd2   swesonga-jdk21-testapp   "/home/<user>/swesonga/…"   0               0B        15 minutes ago   Created   sharp_lamport
4a3be55725b5   4c068055cad5             "/home/<user>/swesonga/…"   0               0B        24 minutes ago   Created   lucid_tharp

Local Volumes space usage:

VOLUME NAME   LINKS     SIZE

Build cache usage: 0B

CACHE ID   CACHE TYPE   SIZE      CREATED   LAST USED   USAGE     SHARED
user@machine:~/swesonga$
I should have been using docker ps -a instead! The -a shows the existing containers (regardless of whether they are running).
user@machine:~/swesonga$ docker ps -a
CONTAINER ID   IMAGE          COMMAND                  CREATED          STATUS    PORTS     NAMES
c77b69082a8a   682fedf54071   "/home/<user>/swesonga/…"   16 minutes ago   Created             awesome_chatelet
58c723638dd2   682fedf54071   "/home/<user>/swesonga/…"   18 minutes ago   Created             sharp_lamport
4a3be55725b5   4c068055cad5   "/home/<user>/swesonga/…"   27 minutes ago   Created             lucid_tharp
user@machine:~/swesonga$
I started displaying the Dockerfile before building and one of the errors I ran into was because I hadn’t saved the Dockerfile. Sheesh.
cat Dockerfile
docker build -t swesonga-jdk21-testapp .
docker ps -a
docker run -i -t swesonga-jdk21-testapp
docker ps -a
docker run -i --memory 2GB -t swesonga-jdk21-testapp
Observe the head of the jdk21 GC log below. The total memory is now reported as 2048M. The maximum heap size is 25% of this total, as expected. The initial heap is 32MB and the minimum heap is 8MB.