Below are some example commands showing how to which assembly instruction to use in the SpinWait() call and how many of them should be used. On my Surface Pro X, the SB instruction is not supported. A good post to read about various barrier instructions is The AArch64 processor (aka arm64), part 14: Barriers – The Old New Thing.
$ $JDKTOTEST/bin/java -Xcomp -XX:-TieredCompilation -XX:+UnlockDiagnosticVMOptions -XX:OnSpinWaitInst=sb ProducerConsumerLoops
Error occurred during initialization of VM
OnSpinWaitInst is SB but current CPU does not support SB instruction

$ $JDKTOTEST/bin/java -Xcomp -XX:-TieredCompilation -XX:+UnlockDiagnosticVMOptions -XX:OnSpinWaitInst=nop -XX:OnSpinWaitInstCount=5 ProducerConsumerLoops
The snippet below shows the 4 instructions in the spin_wait stub if the isb instruction is selected with a count of 3 (after copying the Linux SpinPause implementation). Whether or not this is a good idea is not the point, this is about showing what the flags do.
000001800B9D0700  isb         sy
000001800B9D0704  isb         sy
000001800B9D0708  isb         sy
000001800B9D070C  ret

extern "C" {
  int SpinPause() {
00007FFAB97A5CF8  stp         fp,lr,[sp,#-0x20]!
00007FFAB97A5CFC  mov         fp,sp
    using spin_wait_func_ptr_t = void (*)();
    spin_wait_func_ptr_t func = CAST_TO_FN_PTR(spin_wait_func_ptr_t, StubRoutines::aarch64::spin_wait());
00007FFAB97A5D00  bl          StubRoutines::aarch64::spin_wait (07FFAB97A63B8h)+#0xFFFF8005DA859DF6
00007FFAB97A5D04  mov         x8,x0
00007FFAB97A5D08  str         x8,[sp,#0x10]
    assert(func != nullptr, "StubRoutines::aarch64::spin_wait must not be null.");
00007FFAB97A5D0C  mov         w8,#0
00007FFAB97A5D10  cmp         w8,#0
00007FFAB97A5D14  bne         SpinPause+34h (07FFAB97A5D2Ch)
00007FFAB97A5D18  bl          DebuggingContext::is_enabled (07FFAB8619D18h)+#0xFFFF8005DF5832E8
00007FFAB97A5D1C  uxtb        w8,w0
00007FFAB97A5D20  mov         w8,w8
00007FFAB97A5D24  cmp         w8,#0
00007FFAB97A5D28  bne         SpinPause+74h (07FFAB97A5D6Ch)
00007FFAB97A5D2C  ldr         x8,[sp,#0x10]
00007FFAB97A5D30  cmp         x8,#0
00007FFAB97A5D34  bne         SpinPause+74h (07FFAB97A5D6Ch)
00007FFAB97A5D38  adrp        x8,g_assert_poison (07FFABAA80F88h)+#0xFFFF800635588740
00007FFAB97A5D3C  ldr         x9,[x8,g_assert_poison (07FFABAA80F88h)+#0xFFFF80063E9FB581]
00007FFAB97A5D40  mov         w8,#0x58
00007FFAB97A5D44  strb        w8,[x9]
00007FFAB97A5D48  adrp        x8,siglabels+690h (07FFABA5C5000h)
00007FFAB97A5D4C  add         x3,x8,#0x450
00007FFAB97A5D50  adrp        x8,siglabels+690h (07FFABA5C5000h)
00007FFAB97A5D54  add         x2,x8,#0x488
00007FFAB97A5D58  mov         w1,#0x128
00007FFAB97A5D5C  adrp        x8,siglabels+690h (07FFABA5C5000h)
00007FFAB97A5D60  add         x0,x8,#0x4B0
00007FFAB97A5D64  bl          report_vm_error (07FFAB8D15210h)+#0xFFFF8005DF046B1B
00007FFAB97A5D68  nop
00007FFAB97A5D6C  mov         w8,#0
00007FFAB97A5D70  cmp         w8,#0
00007FFAB97A5D74  bne         SpinPause+14h (07FFAB97A5D0Ch)
    (*func)();
00007FFAB97A5D78  ldr         x8,[sp,#0x10]
00007FFAB97A5D7C  blr         x8
    // If StubRoutines::aarch64::spin_wait consists of only a RET,
    // SpinPause can be considered implemented. There will be a sequence
    // of instructions for:
    // - call of SpinPause
    // - load of StubRoutines::aarch64::spin_wait stub pointer
    // - indirect call of the stub
    // - return from the stub
    // - return from SpinPause
    // So '1' always is returned.
    return 1;
00007FFAB97A5D80  mov         w0,#1
00007FFAB97A5D84  ldp         fp,lr,[sp],#0x20
00007FFAB97A5D88  ret
00007FFAB97A5D8C  ?? ??????
}
SpinPause is also used by the G1 collector as shown in the callstack below:
The previous post covered Building libffi for Windows x64 with Visual C++. In this post, I detail the instructions needed to build for the ARM64 platform (building the zero variant of the HotSpot JVM for the Windows ARM64 platform was my overall objective). I used the same Windows x64 machine for this build. As in the previous post, Visual C++ and MSYS are prerequisites. Get the sources from GitHub:
cd /c/repos
git clone https://github.com/libffi/libffi.git
cd libffi
git checkout v3.4.8
MSYS Prerequisites
Launch MSYS2 and install automake and libtool using these commands:
pacman -S automake
pacman -S libtool
The Visual C++ compiler needs to be available in the path as well. Run cl without any parameters to ensure the compiler is available. If it is available, it must be the ARM64 compiler to ensure we cross-compile! It most likely won’t be by default. If it isn’t, add it to the path as follows:
With the MSYS prerequisites installed, run the autogen.sh script:
user@machine /d/repos/libffi
$ ./autogen.sh
This creates a configure script in the root of the repository. Run it using bash. This command is the main difference between ARM64 and x86_64. Notice that I need to specify various include paths for the ARM64 compiler and linker that were not required in the x86_64 case.
Run make in the root of the repo. The generated LIB and DLL files should be in the aarch64-w64-mingw32/.libs/ subdirectory of the repo root. There will also be ffi.h and ffitarget.h include files in the aarch64-w64-mingw32/include/ subdirectory of the repo root. These 4 files are typically what will be required by other projects with a libffi dependency (like OpenJDK).
$ ls -1 aarch64-w64-mingw32/.libs/
libffi.la
libffi.lai
libffi_convenience.la
libffi_convenience.lib
libffi-8.dll*
libffi-8.exp
libffi-8.lib

$ ls -1 aarch64-w64-mingw32/include/
ffi.h
ffitarget.h
Makefile
Background Investigation Details
Investigating Configure Errors
My initial attempt at building libffi for Windows ARM64 started on the wrong path, based on this quote from libffi/libffi at v3.4.8.
To build static library for ARM64 with MSVC using visual studio solution, msvc_build folder have aarch64/Ffi_staticLib.sln required header files in aarch64/aarch64_include/
I thought this meant that it would be much faster for me to build libffi since I wouldn’t need all these bash configure stuff. The solution informed me that I needed to upgrade the toolset:
I then changed the architecture (in the Configuration Manager dropdown on the standard VS toolbox) from x64 to ARM64. There are a bunch of compiler errors!
1>D:\repos\libffi\src\closures.c(1015,30): error C2039: 'ftramp': is not a member of 'ffi_closure'
1>    D:\repos\libffi\msvc_build\aarch64\aarch64_include\ffi.h(306,16):
1>    see declaration of 'ffi_closure'
...
1>D:\repos\libffi\src\prep_cif.c(248,16): error C2065: 'FFI_BAD_ARGTYPE': undeclared identifier
How could a needed field be missing??!! I tried replacing ffi.h with the one from the x64 build but it was clearly wrong because it had architecture-specific code like this:
/* Specify which architecture libffi is configured for. */
#ifndef X86_WIN64
#define X86_WIN64
#endif
I then checked out the commit that added support for Windows AArch64.
I then tried to configure OpenJDK using this command but the configure script failed!
date; time bash configure --with-jvm-variants=zero --with-libffi=/cygdrive/c/repos/libffi --openjdk-target=aarch64-unknown-cygwin --with-debug-level=slowdebug --with-jtreg=/cygdrive/c/java/binaries/jtreg/jtreg-7.5.1+1 --with-gtest=/cygdrive/c/repos/googletest --with-extra-ldflags=-profile --with-boot-jdk=/cygdrive/c/java/binaries/jdk/x64/jdk-24+36; time /cygdrive/c/repos/scratchpad/scripts/java/cygwin/build-jdk.sh windows aarch64 slowdebug
At this point, I had the build tools installed with the C++ compiler in C:\progra~2\micros~3\2022\buildt~1\vc\tools\msvc\1443~1.348\bin\hostx64\arm64\cl.exe. I opened the VS Installer and installed the ARM64 compiler tools. This was necessary because this script was not present on my machine:
Running vcvarsamd64_arm64.bat initialized the environment for ‘x64_arm64’ (cross-compilation targeting ARM64). I then ran dumpbin to see which symbols were in the .lib file VS generated.
cd /d C:\repos\libffi
dumpbin /all /out:ffi-arm64.txt libffi.lib

cd /d D:\repos\libffi
dumpbin /all /out:ffi-x64.txt libffi.lib
The symbols were very different, which was my sign that I just needed to try building for ARM64 in MSYS2. I also upgraded VS some of the paths use 14.44 and others were 14.43. I started MSYS2 then added the arm64 compiler to the PATH. I tried the long path again but only the 8.3 filename format path worked.
export PATH="/c/Program\ Files/Microsoft\ Visual\ Studio/2022/Enterprise/VC/Tools/MSVC/14.44.35207/bin/Hostx64/arm64/:$PATH"

export PATH="$PATH:/c/Program\ Files/Microsoft\ Visual\ Studio/2022/Enterprise/VC/Tools/MSVC/14.44.35207/bin/Hostx64/arm64/"

# Only this one works.
$ export PATH="$PATH:/c/Progra~1/MIB055~1/2022/Enterprise/VC/Tools/MSVC/14.44.35207/bin/Hostx64/arm64/"

$ where cl.exe
I then switched the repo back to v3.4.8 and ran autogen.sh. This time I specified the –target option to request a aarch64 build. See Specifying Target Triplets (Autoconf) for an overview of the target triplets.
I asked Copilot Which autoconf macro outputs “checking whether the C compiler works” and it said that’s the AC_PROG_CC macro. That string showed up in 3 spots in the codebase but they weren’t what I was looking for. The “checking for C compiler version” was in the generated configure script though.
# Provide some information about the compiler.
printf "%s\n" "$as_me:${as_lineno-$LINENO}: checking for C compiler version" >&5
set X $ac_compile
ac_compiler=$2
for ac_option in --version -v -V -qversion -version; do
  { { ac_try="$ac_compiler $ac_option >&5"
case "(($ac_try" in
  *\"* | *\`* | *\\*) ac_try_echo=\$ac_try;;
  *) ac_try_echo=$ac_try;;
esac
This explained where those odd arguments in the config.log snippet were coming from. The question was now how this was different from the x64 case where it just worked? The diff showed that I was actually still on 3.3-rc0 so I needed to rerun autogen.sh on v3.4.8. I didn’t think I needed the --target option since the correct compiler was selected (as far as I could tell from the --verbose output above).
The configure files were identical in both scenarios. However, there was a key difference in the config logs! Here is a snippet from the working x64 build’s config.log. Notice that the version detection errors were present in this case too (that was a red herring)!
configure:4679: /d/repos/libffi/msvcc.sh -m64 -version >&5
cl : Command line warning D9002 : ignoring unknown option '-version'
cl : Command line error D8003 : missing source filename
configure:4690: $? = 0
configure:4710: checking whether the C compiler works
configure:4732: /d/repos/libffi/msvcc.sh -m64  -DFFI_BUILDING_DLL  conftest.c  >&5
configure:4736: $? = 0
configure:4787: result: yes
configure:4679: /c/repos/libffi/msvcc.sh -marm64 -version >&5
cl : Command line warning D9002 : ignoring unknown option '-version'
cl : Command line error D8003 : missing source filename
configure:4690: $? = 0
configure:4710: checking whether the C compiler works
configure:4732: /c/repos/libffi/msvcc.sh -marm64  -DFFI_BUILDING_DLL  conftest.c  >&5
LINK : fatal error LNK1104: cannot open file 'MSVCRT.lib'
configure:4736: $? = 0
configure:4777: result: no
The linker error was really what I needed to address here. I created this conftest.c file to address the command line compilation issue:
int main (void)
{
  return 0;
}
$ cl -MD -W3 conftest.c
Microsoft (R) C/C++ Optimizing Compiler Version 19.44.35207.1 for ARM64
Copyright (C) Microsoft Corporation.  All rights reserved.

conftest.c
Microsoft (R) Incremental Linker Version 14.44.35207.1
Copyright (C) Microsoft Corporation.  All rights reserved.

/out:conftest.exe
conftest.obj
LINK : fatal error LNK1104: cannot open file 'MSVCRT.lib'
How does OpenJDK get around this? Interestingly, this was when I noticed that the OpenJDK log also had all the version checking errors (-v -V –version, etc). This is the snippet from OpenJDK’s config.log (notice the -libpaths):
configure:105502: checking whether the C compiler works
configure:105524: /cygdrive/d/java/forks/TheShermanTanker/jdk/build/windows-aarch64-zero-slowdebug/fixpath exec /cygdrive/c/progra~1/mib055~1/2022/enterp~1/vc/tools/msvc/1443~1.348/bin/hostx64/arm64/cl.exe   -I/cygdrive/c/progra~1/mib055~1/2022/enterp~1/vc/tools/msvc/1443~1.348/include -I/cygdrive/c/progra~1/mib055~1/2022/enterp~1/vc/tools/msvc/1443~1.348/atlmfc/include -I/cygdrive/c/progra~1/mib055~1/2022/enterp~1/vc/auxili~1/vs/include -I/cygdrive/c/progra~2/wi3cf2~1/10/include/100226~1.0/ucrt -I/cygdrive/c/progra~2/wi3cf2~1/10/include/100226~1.0/um -I/cygdrive/c/progra~2/wi3cf2~1/10/include/100226~1.0/shared -I/cygdrive/c/progra~2/wi3cf2~1/10/include/100226~1.0/winrt -I/cygdrive/c/progra~2/wi3cf2~1/10/include/100226~1.0/cppwinrt -I/cygdrive/c/progra~2/wi3cf2~1/netfxsdk/4.8/include/um   -I/cygdrive/c/progra~1/mib055~1/2022/enterp~1/vc/tools/msvc/1443~1.348/include -I/cygdrive/c/progra~1/mib055~1/2022/enterp~1/vc/tools/msvc/1443~1.348/atlmfc/include -I/cygdrive/c/progra~1/mib055~1/2022/enterp~1/vc/auxili~1/vs/include -I/cygdrive/c/progra~2/wi3cf2~1/10/include/100226~1.0/ucrt -I/cygdrive/c/progra~2/wi3cf2~1/10/include/100226~1.0/um -I/cygdrive/c/progra~2/wi3cf2~1/10/include/100226~1.0/shared -I/cygdrive/c/progra~2/wi3cf2~1/10/include/100226~1.0/winrt -I/cygdrive/c/progra~2/wi3cf2~1/10/include/100226~1.0/cppwinrt -I/cygdrive/c/progra~2/wi3cf2~1/netfxsdk/4.8/include/um  conftest.c  -link   -libpath:/cygdrive/c/progra~1/mib055~1/2022/enterp~1/vc/tools/msvc/1443~1.348/lib/arm64 -libpath:/cygdrive/c/progra~2/wi3cf2~1/10/lib/100226~1.0/ucrt/arm64 -libpath:/cygdrive/c/progra~2/wi3cf2~1/10/lib/100226~1.0/um/arm64 -profile >&5
Microsoft (R) C/C++ Optimizing Compiler Version 19.43.34810 for ARM64
Copyright (C) Microsoft Corporation.  All rights reserved.

conftest.c
Microsoft (R) Incremental Linker Version 14.43.34810.0
Copyright (C) Microsoft Corporation.  All rights reserved.

/out:conftest.exe
-libpath:c:\progra~1\mib055~1\2022\enterp~1\vc\tools\msvc\1443~1.348\lib\arm64
-libpath:c:\progra~2\wi3cf2~1\10\lib\100226~1.0\ucrt\arm64
-libpath:c:\progra~2\wi3cf2~1\10\lib\100226~1.0\um\arm64
-profile
conftest.obj
configure:105528: $? = 0
configure:105579: result: yes
Searching that codebase for libpath led to the location where the -libpath arguments are built in jdk/make/autoconf/toolchain_microsoft.m4. I should do the same thing and set the LDFLAGS.
$ cl -MD -W3 conftest.c -link -libpath:/c/Progra~1/MIB055~1/2022/Enterprise/VC/Tools/MSVC/14.44.35207/lib/arm64 -libpath:/c/progra~2/wi3cf2~1/10/lib/100226~1.0/ucrt/arm64 -libpath:/c/progra~2/wi3cf2~1/10/lib/100226~1.0/um/arm64
Microsoft (R) C/C++ Optimizing Compiler Version 19.44.35207.1 for ARM64
Copyright (C) Microsoft Corporation.  All rights reserved.

conftest.c
Microsoft (R) Incremental Linker Version 14.44.35207.1
Copyright (C) Microsoft Corporation.  All rights reserved.

/out:conftest.exe
-libpath:C:/Progra~1/MIB055~1/2022/Enterprise/VC/Tools/MSVC/14.44.35207/lib/arm64
-libpath:C:/progra~2/wi3cf2~1/10/lib/100226~1.0/ucrt/arm64
-libpath:C:/progra~2/wi3cf2~1/10/lib/100226~1.0/um/arm64
conftest.obj
That succeeded so I tried to set the LDFLAGS for libffi.
Looks like the other paths are being dropped by the script. Further inspection of the script reveals that it has a -L option for these libraries. I tried the -link option but something wasn’t working so I moved on to -L. These are the libraries I needed:
With the above command, the next issue was around cross compiling:
configure: loading site script /etc/config.site
checking build system type... x86_64-w64-mingw32
checking host system type... x86_64-w64-mingw32
checking target system type... x86_64-w64-mingw32
continue configure in default builddir "./x86_64-w64-mingw32"
....exec /bin/sh ../configure "--srcdir=.." "--enable-builddir=x86_64-w64-mingw32" "mingw32"
configure: loading site script /etc/config.site
checking build system type... x86_64-w64-mingw32
checking host system type... x86_64-w64-mingw32
checking target system type... x86_64-w64-mingw32
checking for gsed... sed
checking for a BSD-compatible install... /usr/bin/install -c
checking whether sleep supports fractional seconds... yes
checking filesystem timestamp resolution... 0.01
checking whether build environment is sane... yes
checking for a race-free mkdir -p... /usr/bin/mkdir -p
checking for gawk... gawk
checking whether make sets $(MAKE)... yes
checking whether make supports nested variables... yes
checking xargs -n works... yes
checking for gcc... /c/repos/libffi/msvcc.sh -marm64 -L /c/Progra~1/MIB055~1/2022/Enterprise/VC/Tools/MSVC/14.44.35207/lib/arm64 -L /c/progra~2/wi3cf2~1/10/lib/100226~1.0/ucrt/arm64 -L /c/progra~2/wi3cf2~1/10/lib/100226~1.0/um/arm64
checking whether the C compiler works... yes
checking for C compiler default output file name... conftest.exe
checking for suffix of executables... .exe
checking whether we are cross compiling... configure: error: in '/c/repos/libffi/x86_64-w64-mingw32':
configure: error: cannot run C compiled programs.
If you meant to cross compile, use '--host'.
See 'config.log' for more details
At least this error message let me know what I needed to do to.
Next error after that change in the checking how to run the C++ preprocessor step, specifically error: C++ preprocessor "cl -nologo -EP" fails sanity check.
configure:14431: checking how to run the C++ preprocessor
configure:14498: result: cl -nologo -EP
configure:14512: cl -nologo -EP -DFFI_BUILDING_DLL conftest.cpp
conftest.cpp
conftest.cpp(12): fatal error C1034: limits.h: no include path set
configure:14512: $? = 2
configure: failed program was:
| /* confdefs.h */
| #define PACKAGE_NAME "libffi"
| #define PACKAGE_TARNAME "libffi"
| #define PACKAGE_VERSION "3.4.8"
| #define PACKAGE_STRING "libffi 3.4.8"
| #define PACKAGE_BUGREPORT "http://github.com/libffi/libffi/issues"
| #define PACKAGE_URL ""
| #define PACKAGE "libffi"
| #define VERSION "3.4.8"
| #define LT_OBJDIR ".libs/"
| /* end confdefs.h.  */
| #include <limits.h>
| 		     Syntax error
configure:14547: error: in '/c/repos/libffi/aarch64-w64-mingw32':
configure:14549: error: C++ preprocessor "cl -nologo -EP" fails sanity check
See 'config.log' for more details
The configure script now completed! I had a feeling I would need to keep adding paths like this during the build process.
...
checking size of long double... 0
checking whether byte ordering is bigendian... no
checking assembler .cfi pseudo-op support... no
checking whether compiler supports pointer authentication... no
checking for _ prefix in compiled symbols... no
configure: versioning on shared library symbols is no
checking that generated files are newer than configure... done
configure: creating ./config.status
config.status: creating include/Makefile
config.status: creating include/ffi.h
config.status: creating Makefile
config.status: creating testsuite/Makefile
config.status: creating man/Makefile
config.status: creating doc/Makefile
config.status: creating libffi.pc
config.status: creating fficonfig.h
config.status: executing buildir commands
config.status: create top_srcdir/Makefile guessed from local Makefile
config.status: build in aarch64-w64-mingw32 (HOST=)
config.status: executing depfiles commands
config.status: executing libtool commands
config.status: executing include commands
config.status: executing src commands

real    1m29.429s
user    0m32.473s
sys     0m35.396s
Investigating Build Errors
Just as I suspected, there were build errors when I ran make. Specifically, 8 of these C1083 errors:
libtool: compile:  /c/repos/libffi/msvcc.sh -marm64 -I "/c/Progra~1/MIB055~1/2022/Enterprise/VC/Tools/MSVC/14.44.35207/include" -L "/c/Progra~1/MIB055~1/2022/Enterprise/VC/Tools/MSVC/14.44.35207/lib/arm64" -L "/c/progra~2/wi3cf2~1/10/lib/100226~1.0/ucrt/arm64" -L "/c/progra~2/wi3cf2~1/10/lib/100226~1.0/um/arm64" -DHAVE_CONFIG_H -I. -I.. -I. -I../include -Iinclude -I../src -DFFI_BUILDING_DLL -O2 -c ../src/prep_cif.c  -DDLL_EXPORT -DPIC -o src/.libs/prep_cif.obj
C:/repos/libffi/include\ffi.h(66): fatal error C1083: Cannot open include file: 'stddef.h': No such file or directory
That file lives in C:\Program Files (x86)\Windows Kits\10\Include\10.0.22621.0\ucrt. The OpenJDK build includes these 5 paths (among many others) but I didn’t think I’d need the RT-related paths. I added the other 3 to the configure command then ran make again.
This search for commits did not yield anything but a web search of ksarm64.h – Search led me to the [Arm64/Windows] Missing ksarm64.h ? · Issue #7409 · dotnet/runtime GitHub issue, which said that ksarm64.h is part of the Windows SDK. ksarm64.h isn’t include in Windows SDK – Developer Community was the pointer about where it lives: c/progra~2/wi3cf2~1/10/include/100226~1.0/shared. I had excluded this path because I wanted a minimal set of include paths. This was the next command I tried. I should have exported these paths to an environment variable like I have at the top but I just kept moving forward.
libffi/msvcc.sh at v3.4.8 · libffi/libffi uses cygpath -ma, which outputs mixed absolute paths (windows form with forward slashes). Here is the corrected configure command (without the /cygdrive path prefixes):
This resolved the error about the spaces but then failed with:
Microsoft (R) Library Manager Version 14.44.35207.1
Copyright (C) Microsoft Corporation.  All rights reserved.

LINK : fatal error LNK1181: cannot open input file 'src\.libs\prep_cif.obj'
Here’s the next iteration of the configure script:
...
libtool: compile:  /c/repos/libffi/msvcc.sh -marm64 -I "/c/Progra~1/MIB055~1/2022/Enterprise/VC/Tools/MSVC/14.44.35207/include" -I "/c/progra~2/wi3cf2~1/10/include/100226~1.0/ucrt" -I "/c/progra~2/wi3cf2~1/10/include/100226~1.0/um" -I "/c/progra~2/wi3cf2~1/10/include/100226~1.0/shared" "-L/c/Progra~1/MIB055~1/2022/Enterprise/VC/Tools/MSVC/14.44.35207/lib/arm64" "-L/c/progra~2/wi3cf2~1/10/lib/100226~1.0/ucrt/arm64" "-L/c/progra~2/wi3cf2~1/10/lib/100226~1.0/um/arm64" -DHAVE_CONFIG_H -I. -I.. -I. -I../include -Iinclude -I../src -O2 -c ../src/prep_cif.c  -DDLL_EXPORT -DPIC -o src/.libs/prep_cif.obj
D:/repos/dups/libffi/src/prep_cif.c(219): warning C4273: 'ffi_prep_cif': inconsistent dll linkage
D:/repos/dups/libffi/src/prep_cif.c(225): warning C4273: 'ffi_prep_cif_var': inconsistent dll linkage
D:/repos/dups/libffi/src/prep_cif.c(257): warning C4273: 'ffi_prep_closure': inconsistent dll linkage
D:/repos/dups/libffi/src/prep_cif.c(268): warning C4273: 'ffi_get_struct_offsets': inconsistent dll linkage
...
libtool: compile:  /c/repos/libffi/msvcc.sh -marm64 -I "/c/Progra~1/MIB055~1/2022/Enterprise/VC/Tools/MSVC/14.44.35207/include" -I "/c/progra~2/wi3cf2~1/10/include/100226~1.0/ucrt" -I "/c/progra~2/wi3cf2~1/10/include/100226~1.0/um" -I "/c/progra~2/wi3cf2~1/10/include/100226~1.0/shared" "-L/c/Progra~1/MIB055~1/2022/Enterprise/VC/Tools/MSVC/14.44.35207/lib/arm64" "-L/c/progra~2/wi3cf2~1/10/lib/100226~1.0/ucrt/arm64" "-L/c/progra~2/wi3cf2~1/10/lib/100226~1.0/um/arm64" -DHAVE_CONFIG_H -I. -I.. -I. -I../include -Iinclude -I../src -O2 -c ../src/types.c  -DDLL_EXPORT -DPIC -o src/.libs/types.obj
D:/repos/dups/libffi/src/types.c(77): error C2491: 'ffi_type_void': definition of dllimport data not allowed
D:/repos/dups/libffi/src/types.c(81): error C2491: 'ffi_type_uint8': definition of dllimport data not allowed
D:/repos/dups/libffi/src/types.c(82): error C2491: 'ffi_type_sint8': definition of dllimport data not allowed
D:/repos/dups/libffi/src/types.c(83): error C2491: 'ffi_type_uint16': definition of dllimport data not allowed
D:/repos/dups/libffi/src/types.c(84): error C2491: 'ffi_type_sint16': definition of dllimport data not allowed
D:/repos/dups/libffi/src/types.c(85): error C2491: 'ffi_type_uint32': definition of dllimport data not allowed
D:/repos/dups/libffi/src/types.c(86): error C2491: 'ffi_type_sint32': definition of dllimport data not allowed
D:/repos/dups/libffi/src/types.c(87): error C2491: 'ffi_type_uint64': definition of dllimport data not allowed
D:/repos/dups/libffi/src/types.c(88): error C2491: 'ffi_type_sint64': definition of dllimport data not allowed
D:/repos/dups/libffi/src/types.c(90): error C2491: 'ffi_type_pointer': definition of dllimport data not allowed
D:/repos/dups/libffi/src/types.c(92): error C2491: 'ffi_type_float': definition of dllimport data not allowed
D:/repos/dups/libffi/src/types.c(93): error C2491: 'ffi_type_double': definition of dllimport data not allowed
D:/repos/dups/libffi/src/types.c(111): error C2491: 'ffi_type_longdouble': definition of dllimport data not allowed
This seemed pretty odd, considering these errors didn’t show up for x64. I didn’t see any defines related to DLLs. Upon further inspection, I realized that I had removed the CPPFLAGS variable somewhere along the way! Restoring it finally got the job done! No make errors at all, phew!
I need to understand what happens if we build the jdk master branch (at commit 18cd16d2 when I started) without any ABI-specific changes. To do so, we need JDK 18 or later as a boot JDK to build the latest code, e.g. Oracle’s JDK 18 Windows x64 Installer. Here are the commands I used in Cygwin:
git clone https://github.com/swesonga/jdk
cd jdk

bash configure --openjdk-target=aarch64-unknown-cygwin --with-debug-level=slowdebug --with-boot-jdk=/cygdrive/d/dev/repos/java/infra/binaries/jdk-18.0.2

make images LOG=debug > build/abi-20220802-1500.txt
make build-test-jdk-jtreg-native LOG=debug > build/test-20220802-1500.txt
Once the build complete, create the artifacts for an AArch64 Windows device. These build and archive steps are available as the build-aarch64.sh script.
cd build/windows-aarch64-server-slowdebug/jdk
zip -qru jdk-20220802-1500-master.zip .
mv jdk-20220802-1500-master.zip ..

cd ..
zip -qru test-jdk-20220802-1500-master.zip support/test
Copy the two zip files to the 64-bit ARM device (e.g. by sharing folders or using OneDrive). I used a Surface Pro X device running Windows 11 build 22000.795. I unzipped the 2 files into these paths:
I later discovered that unzip is available in the Git Bash terminal! These commands can be used to unzip the files:
mkdir -p /c/dev/java/abi/devbranch/jdk
cd /c/dev/java/abi/devbranch/jdk
unzip -q /c/dev/java/builds/debug/jdk-20220802-1500-devbranch.zip
cd ..
unzip -q test-jdk-20220802-1500-master.zip
I also downloaded jtreg and placed it in this path (note that it might be easier to extract the .tar.gz on the Windows x64 build machine then share it).
C:\dev\java\jtreg\
Finish setting up the Windows AArch64 device to run the ABI jtreg tests by cloning the OpenJDK repo onto it. The jtreg tests will be run from the root of the OpenJDK repo.
cd \dev\java\repos\forks
git clone https://github.com/swesonga/jdk
cd jdk
We’ll run VaListTest.java to see how it fails on Windows AArch64.
--------------------------------------------------
TEST: java/foreign/valist/VaListTest.java
TEST JDK: C:\dev\java\abi\master\jdk

ACTION: build -- Passed. All files up to date
REASON: Named class compiled on demand
TIME:   0.069 seconds
messages:
command: build VaListTest
reason: Named class compiled on demand
elapsed time (seconds): 0.069

ACTION: testng -- Failed. Execution failed: `main' threw exception: org.testng.TestNGException: An error occurred while instantiating class VaListTest: null
REASON: User specified action: run testng/othervm --enable-native-access=ALL-UNNAMED VaListTest
TIME:   12.557 seconds
messages:
command: testng --enable-native-access=ALL-UNNAMED VaListTest
reason: User specified action: run testng/othervm --enable-native-access=ALL-UNNAMED VaListTest
Mode: othervm [/othervm specified]
Additional options from @modules: --add-modules java.base --add-exports java.base/jdk.internal.foreign=ALL-UNNAMED --add-exports java.base/jdk.internal.foreign.abi=ALL-UNNAMED --add-exports java.base/jdk.internal.foreign.abi.x64=ALL-UNNAMED --add-exports java.base/jdk.internal.foreign.abi.x64.sysv=ALL-UNNAMED --add-exports java.base/jdk.internal.foreign.abi.x64.windows=ALL-UNNAMED --add-exports java.base/jdk.internal.foreign.abi.aarch64=ALL-UNNAMED --add-exports java.base/jdk.internal.foreign.abi.aarch64.linux=ALL-UNNAMED --add-exports java.base/jdk.internal.foreign.abi.aarch64.macos=ALL-UNNAMED --add-exports java.base/jdk.internal.foreign.abi.aarch64.windows=ALL-UNNAMED
elapsed time (seconds): 12.557
configuration:
Boot Layer
  add modules: java.base
  add exports: java.base/jdk.internal.foreign                     ALL-UNNAMED
               java.base/jdk.internal.foreign.abi                 ALL-UNNAMED
               java.base/jdk.internal.foreign.abi.aarch64         ALL-UNNAMED
               java.base/jdk.internal.foreign.abi.aarch64.linux   ALL-UNNAMED
               java.base/jdk.internal.foreign.abi.aarch64.macos   ALL-UNNAMED
               java.base/jdk.internal.foreign.abi.aarch64.windows ALL-UNNAMED
               java.base/jdk.internal.foreign.abi.x64             ALL-UNNAMED
               java.base/jdk.internal.foreign.abi.x64.sysv        ALL-UNNAMED
               java.base/jdk.internal.foreign.abi.x64.windows     ALL-UNNAMED

STDOUT:
STDERR:
WARNING: package jdk.internal.foreign.abi.aarch64.windows not in java.base
org.testng.TestNGException:
An error occurred while instantiating class VaListTest: null
        at org.testng.internal.InstanceCreator.createInstanceUsingObjectFactory(InstanceCreator.java:123)
        at org.testng.internal.InstanceCreator.createInstance(InstanceCreator.java:79)
...
I expected Bernhard’s code to be the one introducing Windows AArch64 ABI clean-up code. So why are there failures about the aarch64.windows foreign abi package missing? This requirement is from VaListTest.java and was introduced by the Foreign Function & Memory API (Preview) PR (it added the java.base/jdk.internal.foreign.abi.aarch64.windows module to the failing test).
Porting the Changes
I worked on porting Bernhard’s code on a Windows x64 machine.
# Switch the the OpenJDK repo directory
cd jdk

# This was the tip of the upstream master branch
# git checkout 18cd16d2eae2ee624827eb86621f3a4ffd98fe8c

git switch -c WinAArch64ABI
git remote add lewurm https://github.com/lewurm/openjdk
git fetch lewurm
git switch foreign-windows-aarch64
git rebase WinAArch64ABI
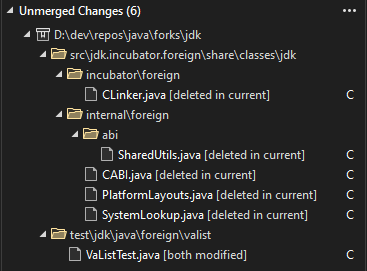
The files he modified have been deleted in the current repo:
$ git log --full-history -2 -- src/jdk.incubator.foreign/share/classes/jdk/incubator/foreign/CLinker.java
commit 2c5d136260fa717afa374db8b923b7c886d069b7

Author: Maurizio Cimadamore <mcimadamore@openjdk.org>
Date:   Thu May 12 16:17:45 2022 +0000

    8282191: Implementation of Foreign Function & Memory API (Preview)

    Reviewed-by: erikj, jvernee, psandoz, dholmes, mchung
The deleted files moved to src/java.base/share/classes/jdk/internal/foreign. Bernhard’s changes are small enough that I manually port them (copy/paste) into the files in the new locations in the tree. It’s interesting seeing the newer Java language features in use, e.g. the permits keyword. Now build the changes using the build-aarch64.sh script:
$ find build/windows-aarch64-server-slowdebug/jdk/ -name "WindowsAArch64CallArranger*"
...
build/windows-aarch64-server-slowdebug/jdk/modules/java.base/jdk/internal/foreign/abi/aarch64/windows/WindowsAArch64CallArranger.class

# Verify last modification time

$ ls -l build/windows-aarch64-server-slowdebug/jdk/./modules/java.base/jdk/internal/foreign/abi/aarch64/windows/WindowsAArch64CallArranger.class
Need to create a WindowsAArch64CallArranger to match the current structure of the foreign ABI. With these changes, VaListTest.java now passes. However, StdLibTest.java and TestVarArgs.java fail.
TEST: java/foreign/StdLibTest.java
TEST JDK: C:\dev\java\abi\devbranch\jdk

ACTION: build -- Passed. All files up to date
REASON: Named class compiled on demand
TIME:   0.039 seconds
messages:
command: build StdLibTest
reason: Named class compiled on demand
elapsed time (seconds): 0.039

ACTION: testng -- Failed. Unexpected exit from test [exit code: -1073741819]
REASON: User specified action: run testng/othervm --enable-native-access=ALL-UNNAMED StdLibTest
TIME:   15.02 seconds
messages:
command: testng --enable-native-access=ALL-UNNAMED StdLibTest
reason: User specified action: run testng/othervm --enable-native-access=ALL-UNNAMED StdLibTest
Mode: othervm [/othervm specified]
elapsed time (seconds): 15.02
configuration:
STDOUT:
test StdLibTest.test_printf([STRING]): failure
java.lang.AssertionError: expected [11] but found [14]
        at org.testng.Assert.fail(Assert.java:99)
        ...
        at org.testng.Assert.assertEquals(Assert.java:917)
        at StdLibTest.test_printf(StdLibTest.java:135)
        ...
        at org.testng.TestNG.run(TestNG.java:1037)
        ...
        at java.base/java.lang.Thread.run(Thread.java:1589)
test StdLibTest.test_printf(java.util.ArrayList@5499b7af): success
test StdLibTest.test_printf([DOUBLE, DOUBLE, CHAR]): success
TEST: java/foreign/TestVarArgs.java
TEST JDK: C:\dev\java\abi\devbranch\jdk

ACTION: build -- Passed. All files up to date
REASON: Named class compiled on demand
TIME:   0.031 seconds
messages:
command: build TestVarArgs
reason: Named class compiled on demand
elapsed time (seconds): 0.031

ACTION: testng -- Failed. Unexpected exit from test [exit code: 1]
REASON: User specified action: run testng/othervm --enable-native-access=ALL-UNNAMED -Dgenerator.sample.factor=17 TestVarArgs
TIME:   17.52 seconds
messages:
command: testng --enable-native-access=ALL-UNNAMED -Dgenerator.sample.factor=17 TestVarArgs
reason: User specified action: run testng/othervm --enable-native-access=ALL-UNNAMED -Dgenerator.sample.factor=17 TestVarArgs
Mode: othervm [/othervm specified]
elapsed time (seconds): 17.52
configuration:
STDOUT:
test TestVarArgs.testVarArgs(0, "f0_V__", VOID, [], []): success
STDERR:
java.lang.RuntimeException: java.lang.IllegalStateException: java.lang.AssertionError: expected [24.0] but found [8.135772792034E-312]
        at TestVarArgs.check(TestVarArgs.java:134)
        ...
        at java.base/java.lang.invoke.MethodHandle.invokeWithArguments(MethodHandle.java:758)
        at TestVarArgs.testVarArgs(TestVarArgs.java:104)
        ...
        at org.testng.TestNG.runSuites(TestNG.java:1069)
        at org.testng.TestNG.run(TestNG.java:1037)
        ...
The data for these tests is supplied by a testngdataProvider that returns an array of arrays of objects. As per the dataProvider docs, the first dimension’s size is the number of times the test method will be invoked and the second dimension size contains an array of objects that must be compatible with the parameter types of the test method.
Java Concepts in the Tests
As per the article Enum Types, enums implicitly extend java.lang.Enum and cannot extend anything else because Java does not support multiple inheritance. The Enum class docs also point out that all the constants of an enum class can be obtained by calling the implicit public static T[] values() method of that class and that more information about enums, including descriptions of the implicitly declared methods synthesized by the compiler, can be found in section 8.9 of The Java Language Specification. Section 8.9 explains that an enum constant may be followed by arguments, which are passed to the constructor of the enum when the constant is created during class initialization as described later in this section. The constructor to be invoked is chosen using the normal rules of overload resolution (§15.12.2). If the arguments are omitted, an empty argument list is assumed. This is helpful for understanding all the code I’m seeing in the PrintfArg enum!
The printfArgs dataProvider permutes the values of the PrintfArg enum. The implementation uses streams, which are new to me since I last wrote Java before JDK 8 was released. The overview of streams on Oracle’s technical resources website is helpful in coming up to speed with streams. TODO: the implementation of the permutation is mysterious to me, need to study it closely. It uses List.of(), Set.of(), and Collections.shuffle().
Try blocks without catch or finally blocks is a try-with-resources statement. This helps prevent leaks of native resources.
StdLibTest.java uses functionality from JEP 424: Foreign Function & Memory API (Preview). This JEP provides a good overview of why we need a supported API for accessing off-heap data (i.e. foreign memory) designed from the ground up to be safe and with JIT optimizations in mind.
Creates a memory segment on line 312 using the allocateUtf8String method of the MemorySession‘s SegmentAllocator base interface. This method “converts a Java string into a UTF-8 encoded, null-terminated C string, storing the result into a memory segment.”
Create a variable argument list using the VaList.make() method. This invokes SharedUtils.newVaList, which we modified to support Windows on AArch64.
Invoke the native vprintf function via its method handle: final static MethodHandle vprintf = abi.downcallHandle(abi.defaultLookup().lookup("vprintf").get(), FunctionDescriptor.of(C_INT, C_POINTER, C_POINTER));.
The value of the abi variable is computed by the SharedUtils.getSystemLinker method, hence the need for creating a WindowsAArch64Linker here. As explained at JEP 424: Foreign Function & Memory API (Preview), abi.defaultLookup() “creates a default lookup, which locates all the symbols in libraries that are commonly used on the OS and processor combination associated with the Linker instance.” defaultLookup() returns a SymbolLookup on which the lookup(“vprintf”) method is invoked. Note that Optional<T>.get() will throw a NoSuchElementException if no value is present. Otherwise, it will return the zero-length MemorySegment whose base address indicates the address of the vprintf function.
As per JEP 424, the Linker interface enables both downcalls (calls from Java code to native code) and upcalls (calls from native code back to Java code). The MemorySegment associated with the address of the vprintf function and a FunctionDescriptor (created by the static FunctionDescriptor.of method) are passed to Linker.downcallHandle to create a MethodHandle which can be used to call vprintf. The arguments to FunctionDescriptor.of are the MemoryLayouts representing the return type (int), the format string, and the format arguments. MethodHandle.invoke() is the how the native vprintf gets, well, invoked, with the format string and the variable argument list. Here’s the Java vprint method.
Inlining the code invoked by test_printf here for easy reference. See the docs for the printf function and the printf format specification for additional information about printf. Line 20 of specializedPrintf creates a MethodType for a method returning an int and taking a single pointer (MemoryAddress). appendParameterTypes is used to add all the other printf parameter types to the MethodType. The MemoryLayouts of the arguments are also accumulated into a list. It doesn’t look like we do anything with the method type (mt) though! Looks like dead code from this PR.
That PR also changed from invokeExact to invoke. Why?
As an aside, notice that the test_time test (and every other test) passed when we disabled test_printf. test_time calls gmtime, which returns a tm struct so that side of things is working fine.
Makes an array-spreading method handle, which accepts an array argument at a given position and spreads its elements as positional arguments in place of the array. The new method handle adapts, as its target, the current method handle. The type of the adapter will be the same as the type of the target, except that the arrayLength parameters of the target’s type, starting at the zero-based position spreadArgPos, are replaced by a single array parameter of type arrayType.
CallArranger.classifyLayout() will return either INTEGER, FLOAT, or POINTER for the case I’m interested in. These cases in UnboxBindingCalculator.getBindings call storageCalculator.nextStorage. DIving into that implementation reveals that we don’t want adjustForVarArgs() to be called! Hmm, after looking at the optimized code in my post on “Building & Disassembling ARM64 Code using Visual C++”, I notice FMOV being used to load general purpose registers x1-x3 with the IEEE double! This looks idfferent from the getBindings implementation, which gets the next storage for FLOATs from the vector registers! et voila! The contradiction I’ve been waiting for: now the addendum on variadic functions at Overview of ARM64 ABI conventions makes sense.
Clone the JitWatch repo. Download the mvn binaries. Set JAVA_HOME to the path of our custom JDK (with hsdis) then start JitWatch. Errors running it though.
No Windows AArch64 binaries at Adoptium or Oracle though.
Let’s just try on x64. Might gain some insight:
cd /d/dev/repos/java/AdoptOpenJDK/jitwatch
/d/dev/repos/java/infra/binaries/jdk-19+34/bin/java --enable-preview -jar ./ui/target/jitwatch-ui-shaded.jar
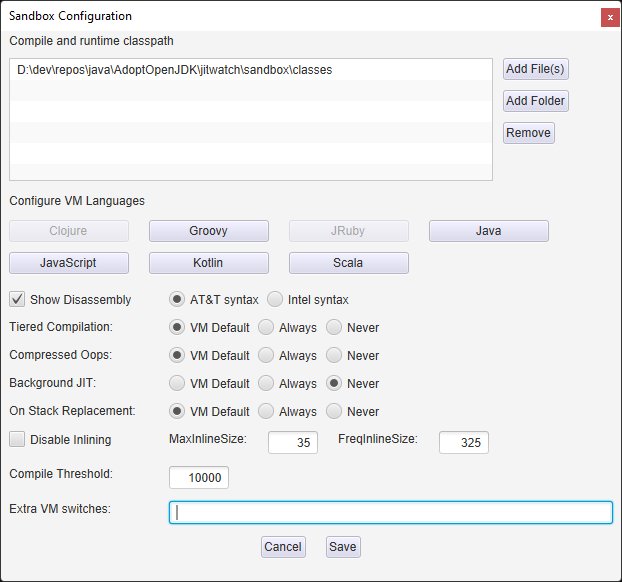
Looking at these options, I wonder if manually setting the Compile Threshold could show more disassembly:
Update JitWatch to support preview features then change JAVA_HOME. This doesn’t make mvn clean package use my latest JDK…
I can get the JIT to assemble for the main method. Why doesn’t this work on Windows for ARM64? Perhaps I should try a non-debug configuration by configuring as follows before running the build-aarch64.sh script:
I get the same results with the release build – no native code for my printf function! I wonder about downloading something heavier and seeing if anything interesting gets compiled to native code. How about Eclipse? Interestingly, there is no Eclipse build for Windows on ARM64!
Examining this reduced output now helps me realize that the double keyword is what I should have been looking for all along! Look at this snippet with arguments that look similar to my modified test case (where I call with a char, a double, and an integer).
I’m still unsure what the parm fields mean but I’m assuming that the double is still being passed in a vector register! Sure enough, I changed the BoxBindingCalculator instead of the UnboxBindingCalculator. Fixed that then reran the test:
The test fails but this time there is a fatal error! Feels like progress.
Note: C:\dev\repos\java\forks\jdk\test\jdk\java\foreign\StdLibTest.java uses preview features of Java SE 20.
Note: Recompile with -Xlint:preview for details.
ACTION: testng -- Failed. Unexpected exit from test [exit code: 1]
REASON: User specified action: run testng/othervm --enable-native-access=ALL-UNNAMED StdLibTest
TIME: 4.783 seconds
messages:
command: testng --enable-native-access=ALL-UNNAMED StdLibTest
reason: User specified action: run testng/othervm --enable-native-access=ALL-UNNAMED StdLibTest
Mode: othervm [/othervm specified]
elapsed time (seconds): 4.783
configuration:
STDOUT:
test StdLibTest.test_printf([INTEGRAL, STRING, CHAR, CHAR]): success
#
# A fatal error has been detected by the Java Runtime Environment:
#
# Internal Error (assembler_aarch64.hpp:253), pid=11060, tid=5996
# guarantee(val < (1ULL << nbits)) failed: Field too big for insn
#
# JRE version: OpenJDK Runtime Environment (20.0) (build 20-internal-adhoc.sawesong.jdk)
# Java VM: OpenJDK 64-Bit Server VM (20-internal-adhoc.sawesong.jdk, mixed mode, tiered, compressed oops, compressed class ptrs, g1 gc, windows-aarch64)
# No core dump will be written.Minidumps are not enabled by default on client versions of Windows
#
# An error report file with more information is saved as:
# C:\dev\repos\java\forks\jdk\JTwork\scratch\0\hs_err_pid11060.log
#
# If you would like to submit a bug report, please visit:
# https://bugreport.java.com/bugreport/crash.jsp
#
hello(42,str,h,h)
Since the fatal error in the JRE states that Minidumps are not enabled by default on client versions of Windows, I enabled collection of dump files using the enable-crash-dumps.bat script. Now we see a minidump written to disk:
C:\dev\java\abi\devbranch5\jdk\bin\java.exe --enable-preview MinimizedStdLibTest
WARNING: A restricted method in java.lang.foreign.Linker has been called
WARNING: java.lang.foreign.Linker::nativeLinker has been called by the unnamed module
WARNING: Use --enable-native-access=ALL-UNNAMED to avoid a warning for this module

# To suppress the following error report, specify this argument
# after -XX: or in .hotspotrc:  SuppressErrorAt=\vmreg_aarch64.hpp:48
#
# A fatal error has been detected by the Java Runtime Environment:
#
#  Internal Error (c:\dev\repos\java\forks\jdk\src\hotspot\cpu\aarch64\vmreg_aarch64.hpp:48), pid=14728, tid=11380
#  assert(is_FloatRegister() && is_even(value())) failed: must be
#
# JRE version: OpenJDK Runtime Environment (20.0) (slowdebug build 20-internal-adhoc.sawesong.jdk)
# Java VM: OpenJDK 64-Bit Server VM (slowdebug 20-internal-adhoc.sawesong.jdk, mixed mode, tiered, compressed oops, compressed class ptrs, g1 gc, windows-aarch64)
# Core dump will be written. Default location: C:\dev\java\abi\tests\hs_err_pid14728.mdmp
#
# An error report file with more information is saved as:
# C:\dev\java\abi\tests\hs_err_pid14728.log
#
# If you would like to submit a bug report, please visit:
#   https://bugreport.java.com/bugreport/crash.jsp
#
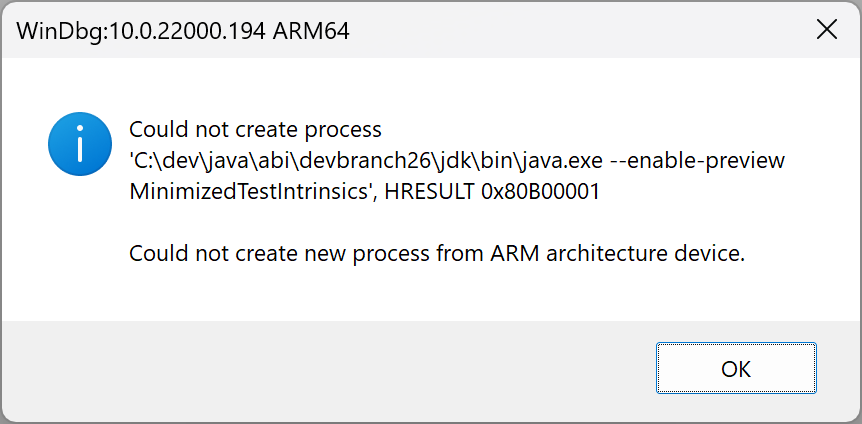
Decide to run java under the debugger and see what happens.
Launch WinDbg and go to File > Open Executable…
Browse to the java.exe path.
Specify the starting directory containing the compiled MinimizedStdLibTest file.
Specify these arguments: --enable-preview MinimizedStdLibTest then click Open.
Press F5 to start the program.
After a few breaks due to unhandled exceptions, I decide to look up the warnings in the text on-screen when a foreign function API is invoked. These messages are from Reflection.ensureNativeAccess and are called by …
WARNING: A restricted method in java.lang.foreign.Linker has been called
WARNING: java.lang.foreign.Linker::nativeLinker has been called by the unnamed module
WARNING: Use --enable-native-access=ALL-UNNAMED to avoid a warning for this module
Debugging in Visual Studio 2019
Create a C++ Console Application then open its Configuration Properties. On the Debug page, change the command, command arguments, and working directory to that of the newly built java.exe. Here are some interesting methods based on exploring after setting breakpoints in methodHandles.cpp:
There are threads with native code (such as the methods above) but no method info. I think those are Java methods. I end up stepping through the code on x64 to gain a better understanding of how the native code stubs are generated. VZEROUPPER motivates a quick detour into AVX-512 just to get a better feel of what it’s about. The instruction set reference (from Intel® 64 and IA-32 Architectures Software Developer Manuals) explains that in 64-bit mode, VZEROUPPER zeroes the bits in positions 128 and higher in YMM0-YMM15 and ZMM0-ZMM15.
I end up updating the test to have a single MethodHandle.invoke() call on its own line to simplify narrowing down the call in the disassembly. To simplify debugging even further, I create another test (MinimizedStdLibTest20Args) with 20 arguments (most of them doubles) that need to be formatted. This should make it easier to identify the code I am interested in and how these arguments are passed. I have a better grasp of x86-64 architecture so that seems like a better place to start examining to better understanding how this native call is handled.
amd64 Disassembly
There are several verified entry points with these many parameters. Why? Here’s the last one on my Intel(R) Xeon(R) W-2133 CPU.
The string “MemberName required for invokeVirtual etc” looks like a unique string and is therefore a reasonable one to use to find the code that set up the entry point. It comes from the generate_method_handle_dispatch method. Placing a breakpoint here reveals an interesting stack:
jvm.dll!MethodHandles::generate_method_handle_dispatch(MacroAssembler * _masm, vmIntrinsicID iid, RegisterImpl * receiver_reg, RegisterImpl * member_reg, bool for_compiler_entry) Line 364	C++
 	jvm.dll!gen_special_dispatch(MacroAssembler * masm, const methodHandle & method, const BasicType * sig_bt, const VMRegPair * regs) Line 1508	C++
 	jvm.dll!SharedRuntime::generate_native_wrapper(MacroAssembler * masm, const methodHandle & method, int compile_id, BasicType * in_sig_bt, VMRegPair * in_regs, BasicType ret_type) Line 1572	C++
 	jvm.dll!AdapterHandlerLibrary::create_native_wrapper(const methodHandle & method) Line 3159	C++
 	jvm.dll!SystemDictionary::find_method_handle_intrinsic(vmIntrinsicID iid, Symbol * signature, JavaThread * __the_thread__) Line 2017	C++
 	jvm.dll!LinkResolver::lookup_polymorphic_method(const LinkInfo & link_info, Handle * appendix_result_or_null, JavaThread * __the_thread__) Line 446	C++
 	jvm.dll!LinkResolver::resolve_method(const LinkInfo & link_info, Bytecodes::Code code, JavaThread * __the_thread__) Line 756	C++
 	jvm.dll!LinkResolver::linktime_resolve_static_method(const LinkInfo & link_info, JavaThread * __the_thread__) Line 1106	C++
 	jvm.dll!LinkResolver::resolve_static_call(CallInfo & result, const LinkInfo & link_info, bool initialize_class, JavaThread * __the_thread__) Line 1072	C++
 	jvm.dll!MethodHandles::resolve_MemberName(Handle mname, Klass * caller, int lookup_mode, bool speculative_resolve, JavaThread * __the_thread__) Line 777	C++
 	jvm.dll!MHN_resolve_Mem(JNIEnv_ * env, _jobject * igcls, _jobject * mname_jh, _jclass * caller_jh, long lookup_mode, unsigned char speculative_resolve) Line 1252	C++
 	0000020a0a26fb92()	Unknown
 	0000020a0058eb00()	Unknown
 	0000005f992fd040()	Unknown
 	0000005f992fd010()	Unknown
This is essentially all the interesting action I have been searching for! Especially AdapterHandlerLibrary::create_native_wrapper, which calls SharedRuntime::java_calling_convention and SharedRuntime::generate_native_wrapper. The latter are exactly what I’ve been seeking!
The VerifyOops flag is off by default so the verify_oop doesn’t generate any code. The testptr is therefore the first MacroAssembler code to be generated. Notice that the code jumps to the MemberName required for invokeVirtual etc label if rcx is zero – that must be error-handling code. The jz mnemonic would be preferrable to je (see assembly – Difference between JE/JNE and JZ/JNZ – Stack Overflow) but they are identical opcodes. Here is the listing with links to the methods that generated them.
class oopDesc {
  friend class VMStructs;
  friend class JVMCIVMStructs;
 private:
  volatile markWord _mark;
  union _metadata {
    Klass*      _klass;
    narrowKlass _compressed_klass;
  } _metadata;
The first movabsq instruction loads (int64_t)CompressedKlassPointers::base() into the temporary register r10. As per NarrowPtrStruct._base, this is the base address for oop-within-java-object materialization. Not yet exactly sure whether that means an offset to add to the klass* to get the virtual address of the object since this base is added to the klass* in rdi. That addition ends the MacroAssembler::load_klass call.
The 2nd movabsq instruction loads the external klass address of the klass with vmClassID java_lang_invoke_MemberName. This value is then compared with the computed klass address in r10. If these 2 values are equal, then all is well and the CPU will branch to L_ok. If this branch is not taken, then the super_check_offset of the MemberName Klass is computed by Klass::super_check_offset. This offset indicates where to look to observe a supertype. So for my purposes, everything in the ;; verify_klass {... ;; } verify_klass section can be ignored since it is MemberName validation.
Without looking at the rest of the assembly code, the key thing to notice is that rcx was assumed to have a MemberName, meaning that by the time all these instructions execute, all the arguments I passed to printf are already in registers/on the stack. A quick detour into the method header is in order though. Here’s the first instance of that signature.
Here is a particularly interesting callstack showing how NEP_makeDowncallStub ends up calling the DowncallStubGenerator.
>	jvm.dll!DowncallStubGenerator::generate() Line 142	C++
 	jvm.dll!DowncallLinker::make_downcall_stub(BasicType * signature, int num_args, BasicType ret_bt, const ABIDescriptor & abi, const GrowableArray<VMRegImpl *> & input_registers, const GrowableArray<VMRegImpl *> & output_registers, bool needs_return_buffer) Line 101	C++
 	jvm.dll!NEP_makeDowncallStub(JNIEnv_ * env, _jclass * _unused, _jobject * method_type, _jobject * jabi, _jobjectArray * arg_moves, _jobjectArray * ret_moves, unsigned char needs_return_buffer) Line 77	C++
 	0000017244641db1()	Unknown
...
What is interesting about this? The DowncallStubGenerator is not only generating assembly instructions that are most likely what I have been searching for, it also has logging code that is being skipped. That looks like unified logging code! Therefore, using +PrintAssembly was not sufficient to generate the code I wanted to see! Here’s an updated command line after which downcall.txt will contain the results of argument shuffling.
Here is a stack revealing a bit more detail about how the arguments are set up.
jvm.dll!SharedRuntime::java_calling_convention(const BasicType * sig_bt, VMRegPair * regs, int total_args_passed) Line 505	C++
jvm.dll!JavaCallingConvention::calling_convention(BasicType * sig_bt, VMRegPair * regs, int num_args) Line 66	C++
jvm.dll!ArgumentShuffle::ArgumentShuffle(BasicType * in_sig_bt, int num_in_args, BasicType * out_sig_bt, int num_out_args, const CallingConventionClosure * input_conv, const CallingConventionClosure * output_conv, VMRegImpl * shuffle_temp) Line 328	C++
jvm.dll!DowncallStubGenerator::generate() Line 141	C++
jvm.dll!DowncallLinker::make_downcall_stub(BasicType * signature, int num_args, BasicType ret_bt, const ABIDescriptor & abi, const GrowableArray<VMRegImpl *> & input_registers, const GrowableArray<VMRegImpl *> & output_registers, bool needs_return_buffer) Line 101	C++
jvm.dll!NEP_makeDowncallStub(JNIEnv_ * env, _jclass * _unused, _jobject * method_type, _jobject * jabi, _jobjectArray * arg_moves, _jobjectArray * ret_moves, unsigned char needs_return_buffer) Line 77	C++
0000017244641db1()	Unknown
More questions about how all this works:
What happens after all the hsdis code is executed? Is the final jump to the native code?
Where is rbx loaded (since that’s what we’re jumping to)?
AArch64 Disassembly
Having now understood that I can log the downcall stubs using the unified logging flags, this is the stub I get on the Surface Pro X (generated by DowncallStubGenerator::generate)
Argument shuffle {
Move a double from ([-1137525940],[-1137525936]) to ([-1137525916],[-1137525912])
Move a double from ([-1137525948],[-1137525944]) to ([-1137525924],[-1137525920])
Move a double from ([-1137525956],[-1137525952]) to ([-1137525932],[-1137525928])
Move a double from ([-1137525964],[-1137525960]) to ([-1137525940],[-1137525936])
Move a double from ([-1137525972],[-1137525968]) to ([-1137525948],[-1137525944])
Move a double from ([-1137525980],[-1137525976]) to ([-1137525956],[-1137525952])
Move a double from ([-1137525988],[-1137525984]) to ([-1137525964],[-1137525960])
Move a double from ([-1137525996],[-1137525992]) to ([-1137525972],[-1137525968])
Move a double from ([-1137526004],[-1137526000]) to ([-1137525980],[-1137525976])
Move a double from ([-1137526012],[-1137526008]) to ([-1137525988],[-1137525984])
Move a double from (v7,v7) to ([-1137525996],[-1137525992])
Move a double from (v6,v6) to ([-1137526004],[-1137526000])
Move a double from (v5,v5) to ([-1137526012],[-1137526008])
Move a double from (v4,v4) to (c_rarg7,c_rarg7)
Move a double from (v3,v3) to (c_rarg6,c_rarg6)
Move a double from (v2,v2) to (c_rarg5,c_rarg5)
Move a long from (c_rarg1,c_rarg1) to (rscratch2,rscratch2)
Move a byte from (c_rarg3,BAD!) to (c_rarg1,BAD!)
Move a int from (c_rarg4,BAD!) to (c_rarg3,BAD!)
Move a double from (v1,v1) to (c_rarg4,c_rarg4)
Move a long from (c_rarg2,c_rarg2) to (c_rarg0,c_rarg0)
Move a double from (v0,v0) to (c_rarg2,c_rarg2)
Stack argument slots: 26
}
It is immediately evident that there are BAD! registers. Why isn’t there more output as one would expect from looking at the additional logging in DowncallStubGenerator::generate? Well, the JVM crash might have something to do with it…
# To suppress the following error report, specify this argument
# after -XX: or in .hotspotrc:  SuppressErrorAt=\vmreg_aarch64.hpp:48
#
# A fatal error has been detected by the Java Runtime Environment:
#
#  Internal Error (c:\dev\repos\java\forks\jdk\src\hotspot\cpu\aarch64\vmreg_aarch64.hpp:48), pid=11888, tid=18884
#  assert(is_FloatRegister() && is_even(value())) failed: must be
#
# JRE version: OpenJDK Runtime Environment (20.0) (slowdebug build 20-internal-adhoc.sawesong.jdk)
# Java VM: OpenJDK 64-Bit Server VM (slowdebug 20-internal-adhoc.sawesong.jdk, compiled mode, tiered, compressed oops, compressed class ptrs, g1 gc, windows-aarch64)
# Core dump will be written. Default location: C:\dev\repos\scratchpad\compilers\tests\aarch64\abi\printf\java\hs_err_pid11888.mdmp
#
# An error report file with more information is saved as:
# C:\dev\repos\scratchpad\compilers\tests\aarch64\abi\printf\java\hs_err_pid11888.log
#
# If you would like to submit a bug report, please visit:
#   https://bugreport.java.com/bugreport/crash.jsp
#
NEP_makeDowncallStub calls ForeignGlobals::parse_vmstorage, which in turn defers to the architecture-specific ForeignGlobals::vmstorage_to_vmreg implementation. This code returns the BAD register if the VMStorage type and does not match the register type! This must be the culprit! How do I log the asString output?
Rexamining the x64 foreign downcall log below, I notice the BAD registers there too! Perhaps this is not an oddity after all. Could it be NativeCallingConvention::calling_convention marking half slots as bad? Actually, notice that in both x64 and AArch64 logs, only the byte and int have these BAD! entries. This must be the other 32-bit slot for the arguments! This means that the AArch64 log is actually fine!
Argument shuffle {
Move a double from ([79203860],[79203864]) to ([79203908],[79203912])
Move a double from ([79203852],[79203856]) to ([79203900],[79203904])
Move a double from ([79203844],[79203848]) to ([79203892],[79203896])
Move a double from ([79203836],[79203840]) to ([79203884],[79203888])
Move a double from ([79203828],[79203832]) to ([79203876],[79203880])
Move a double from ([79203820],[79203824]) to ([79203868],[79203872])
Move a double from ([79203812],[79203816]) to ([79203860],[79203864])
Move a double from ([79203804],[79203808]) to ([79203852],[79203856])
Move a double from ([79203796],[79203800]) to ([79203844],[79203848])
Move a double from ([79203788],[79203792]) to ([79203836],[79203840])
Move a double from ([79203780],[79203784]) to ([79203828],[79203832])
Move a double from (xmm7,xmm7) to ([79203820],[79203824])
Move a double from (xmm6,xmm6) to ([79203812],[79203816])
Move a double from (xmm5,xmm5) to ([79203804],[79203808])
Move a double from (xmm4,xmm4) to ([79203796],[79203800])
Move a double from (xmm3,xmm3) to ([79203788],[79203792])
Move a double from (xmm2,xmm2) to ([79203780],[79203784])
Move a long from (rdx,rdx) to (r10,r10)
Move a byte from (r9,BAD!) to (rdx,BAD!)
Move a int from (rdi,BAD!) to (r9,BAD!)
Move a double from (xmm1,xmm1) to (xmm2,xmm2)
Move a long from (r8,r8) to (rcx,rcx)
Move a double from (xmm0,xmm0) to (r8,r8)
Stack argument slots: 34
}
Back to the MacroAssembler’s and float_move methods… I think the fmovd instruction I seek is this one with a general purpose register operand. After changing double_move to support fmovd between general purpose and floating point registers, rerunning the test on AArch64 does not give any additional output in the downcall log file. Very strange since I don’t see an assertion failure preventing the logging code from running…
I realize though that instead of trying to mess with WinDbg, I can simply write to the unified logging stream (to which output is already successfully being written). Making the LogStream creation unconditional enables me to verify that the code is indeed being executed. __ flush looks like AbstractAssembler::flush. It is only now that I realize that this is not flushing the output stream of the assembler – it is instead invalidating the CPU’s instruction cache! This is done by callingFlushInstructionCache on Windows.
After fixing the assertion failure by now checking the register types for fmovd, I get an OOM. Lots of output in the hotspot.log as well. paste it here. The hsdis output ends with this:
The Chunk::new string is from Chunk::operator new. Before debugging this, I try adding a delay to the NEP.make call to see if the logs I want will be written to disk before the process dies but I still get the OOM without additional logging output.
Next idea, terminate the program with an assertion failure to see if the output will be written to disk at termination. _wassert – Search (bing.com) -> c – Why is `_wassert` wrapped in `(..,0)`? – Stack Overflow. The hotspot asserts appear to be defines for the CRT _assert function. The latter calls abort, which on Windows, lets a custom abort signal handler function to run (enabling cleanup of resources or log information). Does the JVM use this?
I sprinkle DowncallLinker::generate with this logging code: ls.print_cr("Returning stub after %d", __LINE__); The output shows that the generate method completes executing successfully. However, I don’t get any output from logging calls one level below it in the callstack – in DowncallLinker::make_downcall_stub. Commenting out the creation of the new RuntimeStub (by using the aforemention logging call then returning nullptr on the previous line) shows that execution makes it to that point successfully. That has got to be the culprint since logging messages after that stub do not appear in the logs. And now looking at the RuntimeStub class, it is evident that it has an operator new implementation!
Let’s take a look at happens in WinDbg. The bp, bu, bm (Set Breakpoint) and x (Examine Symbols) are quite useful. x * shows the local variables and their values. I didn’t have the matching sources on the Surface Pro when trying to step into DowncallLinker::make_downcall_stub so I cleaned up all the custom logging, committed my changes, and rebuilt the JDK.
bp jvm!NEP_makeDowncallStub
g
x *
Surprisingly, the newly built JDK successfully passes the StdLibTest.java. Unfortunately, it regresses VaListTest.java and still fails TestVarArgs.java. The error from VaListTest is surprising since that was passing before I began but it looks like a compiler error:
--------------------------------------------------
TEST: java/foreign/valist/VaListTest.java
TEST JDK: C:\dev\java\abi\devbranch5\jdk

ACTION: build -- Failed. Compilation failed: Compilation failed
REASON: Named class compiled on demand
TIME:   32.591 seconds
messages:
command: build VaListTest
reason: Named class compiled on demand
Test directory:
  compile: VaListTest
elapsed time (seconds): 32.591

ACTION: compile -- Failed. Compilation failed: Compilation failed
REASON: .class file out of date or does not exist
TIME:   32.384 seconds
messages:
command: compile C:\dev\repos\java\forks\jdk\test\jdk\java\foreign\valist\VaListTest.java
reason: .class file out of date or does not exist
...
direct:
C:\dev\repos\java\forks\jdk\test\jdk\java\foreign\valist\VaListTest.java:153: error: cannot find symbol
            = (builder, scope) -> WindowsAArch64Linker.newVaList(builder, scope.scope());
                                                                               ^
  symbol:   method scope()
  location: variable scope of type MemorySession
Note: C:\dev\repos\java\forks\jdk\test\jdk\java\foreign\valist\VaListTest.java uses preview features of Java SE 20.
Note: Recompile with -Xlint:preview for details.
1 error
...
The rvalue in the failing assignment needs to match the other lines (simply replace with WindowsAArch64Linker.newVaList). Then get this:
test VaListTest.testCopy(VaListTest$$Lambda$125/0x000000080013cb10@1156402a, i32): success
test VaListTest.testCopy(): failure
org.testng.internal.reflect.MethodMatcherException:
[public void VaListTest.testCopy(java.util.function.BiFunction,java.lang.foreign.ValueLayout$OfInt)] has no parameters defined but was found to be using a data provider (either explicitly specified or inherited from class level annotation).
Data provider mismatch
Method: testCopy([Parameter{index=0, type=java.util.function.BiFunction, declaredAnnotations=[]}, Parameter{index=1, type=java.lang.foreign.ValueLayout$OfInt, declaredAnnotations=[]}])
Arguments: [(VaListTest$$Lambda$120/0x000000080013c000) VaListTest$$Lambda$120/0x000000080013c000@6a8ce624,(java.lang.foreign.ValueLayout$OfInt) i32]
        at org.testng.internal.reflect.DataProviderMethodMatcher.getConformingArguments(DataProviderMethodMatcher.java:43)
        at org.testng.internal.Parameters.injectParameters(Parameters.java:905)
        at org.testng.internal.MethodRunner.runInSequence(MethodRunner.java:34)
        at org.testng.internal.TestInvoker$MethodInvocationAgent.invoke(TestInvoker.java:822)
        at org.testng.internal.TestInvoker.invokeTestMethods(TestInvoker.java:147)
        at org.testng.internal.TestMethodWorker.invokeTestMethods(TestMethodWorker.java:146)
        at org.testng.internal.TestMethodWorker.run(TestMethodWorker.java:128)
        at java.base/java.util.ArrayList.forEach(ArrayList.java:1511)
        at org.testng.TestRunner.privateRun(TestRunner.java:764)
        at org.testng.TestRunner.run(TestRunner.java:585)
        at org.testng.SuiteRunner.runTest(SuiteRunner.java:384)
        at org.testng.SuiteRunner.runSequentially(SuiteRunner.java:378)
        at org.testng.SuiteRunner.privateRun(SuiteRunner.java:337)
        at org.testng.SuiteRunner.run(SuiteRunner.java:286)
        at org.testng.SuiteRunnerWorker.runSuite(SuiteRunnerWorker.java:53)
        at org.testng.SuiteRunnerWorker.run(SuiteRunnerWorker.java:96)
        at org.testng.TestNG.runSuitesSequentially(TestNG.java:1218)
        at org.testng.TestNG.runSuitesLocally(TestNG.java:1140)
        at org.testng.TestNG.runSuites(TestNG.java:1069)
        at org.testng.TestNG.run(TestNG.java:1037)
        at com.sun.javatest.regtest.agent.TestNGRunner.main(TestNGRunner.java:93)
        at com.sun.javatest.regtest.agent.TestNGRunner.main(TestNGRunner.java:53)
        at java.base/jdk.internal.reflect.DirectMethodHandleAccessor.invoke(DirectMethodHandleAccessor.java:104)
        at java.base/java.lang.reflect.Method.invoke(Method.java:578)
        at com.sun.javatest.regtest.agent.MainWrapper$MainThread.run(MainWrapper.java:125)
        at java.base/java.lang.Thread.run(Thread.java:1589)
Turns out to be a porting bug in which copy() used winAArch64VaListFactory instead of winAArch64VaListScopedFactory. Thankfully the test passes after this fix. Unfortunately, TestVaArgs.java still fails:
STDOUT:
test TestVarArgs.testVarArgs(0, "f0_V__", VOID, [], []): success
test TestVarArgs.testVarArgs(17, "f0_V_S_DI", VOID, [STRUCT], [DOUBLE, INT]): success
test TestVarArgs.testVarArgs(34, "f0_V_S_IDF", VOID, [STRUCT], [INT, DOUBLE, FLOAT]): success
test TestVarArgs.testVarArgs(51, "f0_V_S_FDD", VOID, [STRUCT], [FLOAT, DOUBLE, DOUBLE]): success
test TestVarArgs.testVarArgs(68, "f0_V_S_DDP", VOID, [STRUCT], [DOUBLE, DOUBLE, POINTER]): success
test TestVarArgs.testVarArgs(85, "f0_V_S_PPI", VOID, [STRUCT], [POINTER, POINTER, INT]): success
test TestVarArgs.testVarArgs(102, "f0_V_IS_FF", VOID, [INT, STRUCT], [FLOAT, FLOAT]): failure
java.lang.ArrayIndexOutOfBoundsException: Index 0 out of bounds for length 0
        at java.base/jdk.internal.foreign.abi.aarch64.windows.WindowsAArch64CallArranger$StorageCalculator.regAlloc(WindowsAArch64CallArranger.java:230)
        at java.base/jdk.internal.foreign.abi.aarch64.windows.WindowsAArch64CallArranger$UnboxBindingCalculator.getBindings(WindowsAArch64CallArranger.java:369)
        at java.base/jdk.internal.foreign.abi.aarch64.windows.WindowsAArch64CallArranger.getBindings(WindowsAArch64CallArranger.java:150)
        at java.base/jdk.internal.foreign.abi.aarch64.windows.WindowsAArch64CallArranger.arrangeDowncall(WindowsAArch64CallArranger.java:157)
        at java.base/jdk.internal.foreign.abi.aarch64.windows.WindowsAArch64Linker.arrangeDowncall(WindowsAArch64Linker.java:85)
        at java.base/jdk.internal.foreign.abi.AbstractLinker.lambda$downcallHandle$0(AbstractLinker.java:53)
        at java.base/jdk.internal.foreign.abi.SoftReferenceCache$Node.get(SoftReferenceCache.java:52)
        at java.base/jdk.internal.foreign.abi.SoftReferenceCache.get(SoftReferenceCache.java:38)
        at java.base/jdk.internal.foreign.abi.AbstractLinker.downcallHandle(AbstractLinker.java:51)
        at java.base/java.lang.foreign.Linker.downcallHandle(Linker.java:221)
        at TestVarArgs.testVarArgs(TestVarArgs.java:97)
        at java.base/jdk.internal.reflect.DirectMethodHandleAccessor.invoke(DirectMethodHandleAccessor.java:104)
        at ...
        at java.base/java.lang.Thread.run(Thread.java:1589)

test TestVarArgs.testVarArgs(119, "f0_V_IS_IFD", VOID, [INT, STRUCT], [INT, FLOAT, DOUBLE]): success
test TestVarArgs.testVarArgs(136, "f0_V_IS_FFP", VOID, [INT, STRUCT], [FLOAT, FLOAT, POINTER]): success
test TestVarArgs.testVarArgs(153, "f0_V_IS_DDI", VOID, [INT, STRUCT], [DOUBLE, DOUBLE, INT]): success
test TestVarArgs.testVarArgs(170, "f0_V_IS_PDF", VOID, [INT, STRUCT], [POINTER, DOUBLE, FLOAT]): success
# To suppress the following error report, specify this argument
# after -XX: or in .hotspotrc:  SuppressErrorAt=\code/vmreg.hpp:147
#
# A fatal error has been detected by the Java Runtime Environment:
#
#  Internal Error (c:\dev\repos\java\forks\jdk\src\hotspot\share\code/vmreg.hpp:147), pid=10580, tid=10896
#  assert(is_stack()) failed: Not a stack-based register
#
# JRE version: OpenJDK Runtime Environment (20.0) (slowdebug build 20-internal-adhoc.sawesong.jdk)
# Java VM: OpenJDK 64-Bit Server VM (slowdebug 20-internal-adhoc.sawesong.jdk, mixed mode, tiered, compressed oops, compressed class ptrs, g1 gc, windows-aarch64)
# Core dump will be written. Default location: C:\dev\repos\java\forks\jdk\JTwork\scratch\0\hs_err_pid10580.mdmp
#
# An error report file with more information is saved as:
# C:\dev\repos\java\forks\jdk\JTwork\scratch\0\hs_err_pid10580.log
#
# If you would like to submit a bug report, please visit:
#   https://bugreport.java.com/bugreport/crash.jsp
#
The problem turns out to be the fact that I had removed the vector registers from the list of input registers but the HFA code expects these to exist. The Windows AArch64 ABI also expected these vector registers to be used in this scenario. Restoring them addresses this bug, getting us back to the original failure (before I made any changes):
--------------------------------------------------
TEST: java/foreign/TestVarArgs.java
TEST JDK: C:\dev\java\abi\devbranch6\jdk

ACTION: build -- Passed. All files up to date
REASON: Named class compiled on demand
TIME:   0.015 seconds
messages:
command: build TestVarArgs
reason: Named class compiled on demand
elapsed time (seconds): 0.015

ACTION: testng -- Failed. Unexpected exit from test [exit code: 1]
REASON: User specified action: run testng/othervm --enable-native-access=ALL-UNNAMED -Dgenerator.sample.factor=17 TestVarArgs
TIME:   18.911 seconds
messages:
command: testng --enable-native-access=ALL-UNNAMED -Dgenerator.sample.factor=17 TestVarArgs
reason: User specified action: run testng/othervm --enable-native-access=ALL-UNNAMED -Dgenerator.sample.factor=17 TestVarArgs
Mode: othervm [/othervm specified]
elapsed time (seconds): 18.911
configuration:
STDOUT:
test TestVarArgs.testVarArgs(0, "f0_V__", VOID, [], []): success
test TestVarArgs.testVarArgs(17, "f0_V_S_DI", VOID, [STRUCT], [DOUBLE, INT]): success
test TestVarArgs.testVarArgs(34, "f0_V_S_IDF", VOID, [STRUCT], [INT, DOUBLE, FLOAT]): success
test TestVarArgs.testVarArgs(51, "f0_V_S_FDD", VOID, [STRUCT], [FLOAT, DOUBLE, DOUBLE]): success
test TestVarArgs.testVarArgs(68, "f0_V_S_DDP", VOID, [STRUCT], [DOUBLE, DOUBLE, POINTER]): success
test TestVarArgs.testVarArgs(85, "f0_V_S_PPI", VOID, [STRUCT], [POINTER, POINTER, INT]): success
STDERR:
java.lang.RuntimeException: java.lang.IllegalStateException: java.lang.AssertionError: expected [12.0] but found [2.8E-45]
        at TestVarArgs.check(TestVarArgs.java:134)
        at java.base/java.lang.invoke.MethodHandle.invokeWithArguments(MethodHandle.java:733)
        at java.base/java.lang.invoke.MethodHandle.invokeWithArguments(MethodHandle.java:758)
        at TestVarArgs.testVarArgs(TestVarArgs.java:104)
        at java.base/jdk.internal.reflect.DirectMethodHandleAccessor.invoke(DirectMethodHandleAccessor.java:104)
        at java.base/java.lang.reflect.Method.invoke(Method.java:578)
        at org.testng.internal.MethodInvocationHelper.invokeMethod(MethodInvocationHelper.java:132)
        at org.testng.internal.TestInvoker.invokeMethod(TestInvoker.java:599)
        at org.testng.internal.TestInvoker.invokeTestMethod(TestInvoker.java:174)
        at org.testng.internal.MethodRunner.runInSequence(MethodRunner.java:46)
        at org.testng.internal.TestInvoker$MethodInvocationAgent.invoke(TestInvoker.java:822)
        at org.testng.internal.TestInvoker.invokeTestMethods(TestInvoker.java:147)
        at org.testng.internal.TestMethodWorker.invokeTestMethods(TestMethodWorker.java:146)
        at org.testng.internal.TestMethodWorker.run(TestMethodWorker.java:128)
        at java.base/java.util.ArrayList.forEach(ArrayList.java:1511)
        at org.testng.TestRunner.privateRun(TestRunner.java:764)
        at org.testng.TestRunner.run(TestRunner.java:585)
        at org.testng.SuiteRunner.runTest(SuiteRunner.java:384)
        at org.testng.SuiteRunner.runSequentially(SuiteRunner.java:378)
        at org.testng.SuiteRunner.privateRun(SuiteRunner.java:337)
        at org.testng.SuiteRunner.run(SuiteRunner.java:286)
        at org.testng.SuiteRunnerWorker.runSuite(SuiteRunnerWorker.java:53)
        at org.testng.SuiteRunnerWorker.run(SuiteRunnerWorker.java:96)
        at org.testng.TestNG.runSuitesSequentially(TestNG.java:1218)
        at org.testng.TestNG.runSuitesLocally(TestNG.java:1140)
        at org.testng.TestNG.runSuites(TestNG.java:1069)
        at org.testng.TestNG.run(TestNG.java:1037)
        at com.sun.javatest.regtest.agent.TestNGRunner.main(TestNGRunner.java:93)
        at com.sun.javatest.regtest.agent.TestNGRunner.main(TestNGRunner.java:53)
        at java.base/jdk.internal.reflect.DirectMethodHandleAccessor.invoke(DirectMethodHandleAccessor.java:104)
        at java.base/java.lang.reflect.Method.invoke(Method.java:578)
        at com.sun.javatest.regtest.agent.MainWrapper$MainThread.run(MainWrapper.java:125)
        at java.base/java.lang.Thread.run(Thread.java:1589)
Caused by: java.lang.IllegalStateException: java.lang.AssertionError: expected [12.0] but found [2.8E-45]
        at CallGeneratorHelper.lambda$initStruct$10(CallGeneratorHelper.java:443)
        at TestVarArgs.lambda$check$4(TestVarArgs.java:132)
        at java.base/java.util.ArrayList.forEach(ArrayList.java:1511)
        at TestVarArgs.check(TestVarArgs.java:132)
        ... 32 more
Caused by: java.lang.AssertionError: expected [12.0] but found [2.8E-45]
        at org.testng.Assert.fail(Assert.java:99)
        at org.testng.Assert.failNotEquals(Assert.java:1037)
        at org.testng.Assert.assertEqualsImpl(Assert.java:140)
        at org.testng.Assert.assertEquals(Assert.java:122)
        at org.testng.Assert.assertEquals(Assert.java:617)
        at CallGeneratorHelper.lambda$makeArg$8(CallGeneratorHelper.java:413)
        at CallGeneratorHelper.lambda$initStruct$10(CallGeneratorHelper.java:441)
        ... 35 more
Examining the test source shows that upcalls can also be traced using -XX:+TraceOptimizedUpcallStubs. I wonder how many other tests are failing though since I didn’t expect this failure. Rerunning them all results in these failures:
The bug is that reg2offset_out is called on a single physical register on line 5894! This happens because the src.is_single_phys_reg returns false. I break out the local variables to get an explicit breakdown in the debugger:
// A float arg may have to do float reg int reg conversion
void MacroAssembler::float_move(VMRegPair src, VMRegPair dst, Register tmp) {
 VMReg src_first = src.first();
 VMReg dst_first = dst.first();
 if (src_first->is_stack()) {
    if (dst_first->is_stack()) {
      ldrw(tmp, Address(rfp, reg2offset_in(src.first())));
      strw(tmp, Address(sp, reg2offset_out(dst_first)));
    } else {
      ldrs(dst.first()->as_FloatRegister(), Address(rfp, reg2offset_in(src_first)));
    }
  } else if (src_first != dst_first) {
    bool src_is_single_phys_reg = src.is_single_phys_reg();
    bool dst_is_single_phys_reg = dst.is_single_phys_reg();

    bool src_is_float_reg = src_first->is_FloatRegister();
    bool src_is_reg = src_first->is_Register();

    bool dst_is_float_reg = dst_first->is_FloatRegister();
    bool dst_is_reg = dst_first->is_Register();

    if (src_is_single_phys_reg && dst_is_single_phys_reg)
      fmovs(dst_first->as_FloatRegister(), src_first->as_FloatRegister());
    else
      strs(src_first->as_FloatRegister(), Address(sp, reg2offset_out(dst_first)));
  }
}
Interestingly, the src register is a floating point register but the name is c_arg0. It is confusing to me that the regName field in both the source’s _first and _second fields point to the same location as the destination’s _first and _second VMRegImpl::regName pointers. Looking at the source, this makes sense because the regName pointer is a static field (missed this in WinDbg) and is set by the staticset_regName method.
Notice that ArgumentShuffle::ArgumentShuffle calls NativeCallingConvention::calling_convention, which in turn calls out_regs[i].set1(reg). The set1 method explicitly sets _second to BAD (which is first() – 1). set2() on the other hand sets _second to first() + 1. The solution is then to simply check whether the dst is a register since it will not be a single physical register in this scenario. This fix addresses the assertion failure. We should now be able to get downcall logging.
java.lang.Exception: Expected 2 but found 4621819117588971520
java.lang.Exception: Expected 0 but found 2
java.lang.Exception: Expected 13 but found 0
java.lang.Exception: Expected a but found
4621819117588971520 is 0x4024000000000000, nothing revealing about that value. The native functions that were invoked must be invoke_high_arity2, invoke_high_arity4, invoke_high_arity5 , and invoke_high_arity6 since they are the only ones that match those expected return values. I remove the loop to run invoke_high_arity2 only. Here’s a snippet of the downcall log:
Argument shuffle {
Move a int from (c_rarg2,BAD!) to (c_rarg0,BAD!)
Move a long from (c_rarg3,c_rarg3) to (c_rarg2,c_rarg2)
Move a float from (v1,BAD!) to (c_rarg3,BAD!)
Move a long from (c_rarg1,c_rarg1) to (rscratch2,rscratch2)
Move a double from (v0,v0) to (c_rarg1,c_rarg1)
Stack argument slots: 0
}
[CodeBlob (0x00000259e688df90)]
Framesize: 4
Runtime Stub (0x00000259e688df90): nep_invoker_blob
--------------------------------------------------------------------------------
Decoding CodeBlob, name: nep_invoker_blob, at  [0x00000259e688e040, 0x00000259e688e118]  216 bytes
  0x00000259e688e040:   	stp	x29, x30, [sp, #-0x10]!
  0x00000259e688e044:   	mov	x29, sp
  0x00000259e688e048:   	sub	sp, x29, #0x10
  0x00000259e688e04c:   	adr	x9, #0x0
  0x00000259e688e050:   	str	x9, [x28, #0x318]
  0x00000259e688e054:   	mov	x9, sp
  0x00000259e688e058:   	str	x9, [x28, #0x310]
  0x00000259e688e05c:   	str	x29, [x28, #0x320]
 ;; 0x4
  0x00000259e688e060:   	orr	x9, xzr, #0x4
  0x00000259e688e064:   	add	x10, x28, #0x3c4
  0x00000259e688e068:   	stlr	w9, [x10]
 ;; { argument shuffle
 ;; bt=int
  0x00000259e688e06c:   	sxtw	x0, w2
 ;; bt=long
  0x00000259e688e070:   	mov	x2, x3
 ;; bt=float
  0x00000259e688e074:   	fmov	w3, s1
 ;; bt=long
  0x00000259e688e078:   	mov	x9, x1
 ;; bt=double
  0x00000259e688e07c:   	fmov	x1, d0
 ;; } argument shuffle
  0x00000259e688e080:   	blr	x9
Notice that the instructions correctly load the registers x0-x3. The question now is where the return value is used after this function. Here are the rest of the instructions:
I needed to search for B.cond in the ARM Architecture Reference Manual for A-profile architecture PDF. The HI mnemonic in b.hi means unsigned higher and is equivalent to the condition flags C==1 && Z == 0. This branch is to the safepoint poll slow path, which is the label immediately following the L_safepoint_poll_slow_path comment. I found it strange that 0x00000259e688e0a0 + #0x3c = 0x259E688E0DC, which is the 2nd instruction after the L_safepoint_poll_slow_path label. However, the B.cond documentation states that the program label to be conditionally branched to is given by an offset from the address of the branch instruction.
Looks like most of the above code is not relevant because it doesn’t touch x0. At this point, it seems like the problem could be in the native code we’re branching into. I set a breakpoint in invoke but the code doesn’t seem to make much sense:
bp intrinsics!invoke_high_arity2
Let us disassemble support/test/jdk/jtreg/native/lib/Intrinsics.dll and see what the compiler generated.
cd build\windows-aarch64-server-slowdebug\support\test\jdk\jtreg\native\support\libIntrinsics\
dumpbin /disasm /out:Intrinsics.asm libIntrinsics.obj
dumpbin /all /out:Intrinsics.txt libIntrinsics.obj
Here is the relevant code, which makes it apparent that libIntrinsics is not expecting floating point parameters in general purpose registers!
I update the WindowsAArch64CallArranger to specifically use general purpose registers for floating point data only for variadic FunctionDescriptors. This fixes both TestIntrinsics and TestUpcallHighArity but not TestVarArgs so I create a self contained test for it: MinimizedTestVarArgs.
TestVarArgs
This test depends on the native varargs.dll (built from libVarArgs.c). This DLL can be found in the build/windows-x86_64-server-slowdebug/support/test/jdk/jtreg/native/lib/ directory.
How does the test work?
It uses upcalls, how do they work?
Here’s how the native upcall linker is invoked to create an upcall stub:
These logging options generate argument shuffling output only. I expected to see comments like on_entry.
[8.157s][trace][foreign,upcall] Argument shuffle {
[8.157s][trace][foreign,upcall] Move a long from (c_rarg1,c_rarg1) to (c_rarg3,c_rarg3)
[8.157s][trace][foreign,upcall] Move a int from (c_rarg0,BAD!) to (c_rarg2,BAD!)
[8.157s][trace][foreign,upcall] Stack argument slots: 0
[8.158s][trace][foreign,upcall] }
[8.860s][trace][foreign,downcall] Argument shuffle {
[8.860s][trace][foreign,downcall] Move a long from (c_rarg1,c_rarg1) to (rscratch2,rscratch2)
[8.860s][trace][foreign,downcall] Move a int from (c_rarg3,BAD!) to (c_rarg1,BAD!)
[8.860s][trace][foreign,downcall] Move a long from (c_rarg2,c_rarg2) to (c_rarg0,c_rarg0)
[8.862s][trace][foreign,downcall] Stack argument slots: 0
[8.862s][trace][foreign,downcall] }
[8.862s][trace][foreign,downcall] [CodeBlob (0x0000027b876f0810)]
[8.862s][trace][foreign,downcall] Framesize: 2
[8.862s][trace][foreign,downcall] Runtime Stub (0x0000027b876f0810): nep_invoker_blob
[8.862s][trace][foreign,downcall] --------------------------------------------------------------------------------
[8.862s][trace][foreign,downcall] Decoding CodeBlob, name: nep_invoker_blob, at  [0x0000027b876f08c0, 0x0000027b876f0980]  192 bytes
[8.879s][trace][foreign,downcall]   0x0000027b876f08c0:   	stp	x29, x30, [sp, #-0x10]!
[8.879s][trace][foreign,downcall]   0x0000027b876f08c4:   	mov	x29, sp
...
That is not sufficient though. Simply outputs this to the command prompt:
[CodeBlob (0x0000025291ffe090)]
Framesize: 0
UpcallStub (0x0000025291ffe090) used for upcall_stub_(Ljava/lang/Object;IJ)V
[CodeBlob (0x0000025291ffe090)]
Framesize: 0
UpcallStub (0x0000025291ffe090) used for upcall_stub_(Ljava/lang/Object;IJ)V
...
The UpcallStub constructor turns out to have the UpcallStub tracing code (notice the stub name “UpcallStub”). It expects the PrintStubCode flag. This outputs the disassembly as I expected but does so for just about everything – 10MB of text. The stub name can be used to narrow down the calls we’re interested in.
cd build\windows-aarch64-server-slowdebug\support\test\jdk\jtreg\native\support\libVarArgs\
dumpbin /disasm /out:libVarArgs.asm libVarArgs.obj
dumpbin /all /out:libVarArgs.txt libVarArgs.obj
Setting aside all this learning and simply reviewing the Overview of ARM64 ABI conventions, the statement that floating-point values are returned in s0, d0, or v0, as appropriate should be enough to track down the bug. The change I made to the CallArranger switched the floating point storage to a general purpose register whenever floating point storage was requested for a variadic function. However, this doesn’t fix the test, thereby showing the value of understanding exactly how things are flowing through registers!
Understanding libVarArgs
The varargs function does not return a value. Here is an interpretation of the disassembly:
;$LN2:
;;
;; i++
;;
  0000000000000044: B9400BE8  ldr         w8,[sp,#8]
  0000000000000048: 11000508  add         w8,w8,#1
  000000000000004C: B9000BE8  str         w8,[sp,#8]
$LN4:
;;
;; i < num
;;
  0000000000000050: B9401FE9  ldr         w9,[sp,#0x1C]
  0000000000000054: B9400BE8  ldr         w8,[sp,#8]
  0000000000000058: 6B09011F  cmp         w8,w9
  000000000000005C: 5400F66A  bge         $LN3
;;
;; x8 = info
;;
  0000000000000060: F9401FE8  ldr         x8,[sp,#0x38]
;;
;; x10 = &info->argids
;;
  0000000000000064: 9100210A  add         x10,x8,#8
;;
;; x9 = i * 4
;;
  0000000000000068: B9400BE8  ldr         w8,[sp,#8]
  000000000000006C: 93407D09  sxtw        x9,w8
  0000000000000070: D2800088  mov         x8,#4
  0000000000000074: 9B087D29  mul         x9,x9,x8
;;
;; Get the pointer from the call_info
;;
  0000000000000078: F9400148  ldr         x8,[x10]
;;
;; computer the offset of element [i]
;;
  000000000000007C: 8B090108  add         x8,x8,x9
;;
;; w8 = info->argids[i];
;;
  0000000000000080: B9400108  ldr         w8,[x8]
  0000000000000084: B90023E8  str         w8,[sp,#0x20]
  0000000000000088: B94023E8  ldr         w8,[sp,#0x20]
  000000000000008C: B9001BE8  str         w8,[sp,#0x18]
  0000000000000090: B9401BE8  ldr         w8,[sp,#0x18]
;;
;; There are 88 (0x58) enums.
;;
  0000000000000094: 71015D1F  cmp         w8,#0x57
;;
;; Go to default case if not one of the defined enums
;;
  0000000000000098: 5400F3E8  bhi         $LN95
;;
;; w10 = info->argids[i];
;;
  000000000000009C: B9401BEA  ldr         w10,[sp,#0x18]
;;
;; x9 = PC-relative address of $LN100
;;
  00000000000000A0: 1000F509  adr         x9,$LN100
;;
;; uxtw: unsigned word extend
;; load a signed offset from the table at $LN100
;; x8 = sign-extend([x9 + w10 * 4])
;;
  00000000000000A4: B8AA5928  ldrsw       x8,[x9,w10 uxtw #2]
;;
;; x9 = PC-relative address of $LN51 (half-way point in the switch/45th label from here)
;;
  00000000000000A8: 10007969  adr         x9,$LN51
;;
;; x8 = address of the case statement to jump to
;; why the left shift though?
;;
  00000000000000AC: 8B080928  add         x8,x9,x8,lsl #2
  00000000000000B0: D61F0100  br          x8

...
$LN95:
  0000000000001F14: 12800000  mov         w0,#-1
  0000000000001F18: 90000008  adrp        x8,__imp_exit
  0000000000001F1C: F9400108  ldr         x8,[x8,__imp_exit]
  0000000000001F20: D63F0100  blr         x8
$LN188:
  0000000000001F24: 17FFF848  b           $LN2

;; va_end(a_list);
;; This expands to ((void)(a_list = (va_list)0))
;;
$LN3:
  0000000000001F28: D2800008  mov         x8,#0
  0000000000001F2C: F90003E8  str         x8,[sp]

;;
;; cleanup before returning
;;
  0000000000001F30: 9132C3FF  add         sp,sp,#0xCB0
  0000000000001F34: 94000000  bl          __security_pop_cookie
  0000000000001F38: A8C47BFD  ldp         fp,lr,[sp],#0x40
  0000000000001F3C: D65F03C0  ret
$LN100:
  0000000000001F40: FFFFFC38
$LN101:
  0000000000001F44: FFFFFC49
The unconditional branch to the address in x8 is to the upcall stub.Notice from the setup for the branch that the target is invoked by the blr.
Stepping through the code, I decide to look up the void* parameter that was passed into the upcall stub (just before the last instruction of preserve_callee_saved_regs – str d24, [sp, #0xd0]). Perhaps a more reasonable point would be at the end of the argument shuffle but the values will be the same ones below:
The 64-bit value is 0x4038000000000000. The program below confirms this value to be 24.0. Therefore, everything has been correctly set up for the upcall.
#include <stdio.h>

int main()
{
    __int64 i = 0x4038000000000000;
    double* d = (double*)&i;
    printf("%f", *d);
}
Review earlier 0x4024 value.
Review set of volatile registers defined by the ABI since that’s what ends up in the upcall stub.
A good place to break is jvm!UpcallLinker::on_entry
Why don’t we review how these cases are handled in the native code? Here is the definition of va_arg from C:\Program Files\Microsoft Visual Studio\2022\Preview\VC\Tools\MSVC\14.34.31823\include\vadefs.h:
Below is the disassembly for the first case in libVarArgs.c. The 2nd definition of __crt_va_arg is used on ARM64. The _SLOTSIZEOF evaluates to 8 for both int and double. TODO: finish explaining this assembly.
So why does TestUpcallArity pass? It does not use variadic functions! I update MinimizedTestVarArgs to show the function signature codes when it fails. From the resulting log, a struct is being passed to the downcall.
f0_V_S_F java.lang.Exception: Expected 12.0 but found 7.95336E-11
f0_V_S_D java.lang.Exception: Expected 24.0 but found 9.022351855793E-312
f0_V_S_FF java.lang.Exception: Expected 12.0 but found 2.2120472E-11
f0_V_S_FF java.lang.Exception: Expected 12.0 but found 5.96E-43
f0_V_S_DD java.lang.Exception: Expected 24.0 but found 9.02227530708E-312
f0_V_S_DD java.lang.Exception: Expected 24.0 but found 4.9E-324
f0_V_S_FFF java.lang.Exception: Expected 12.0 but found 2.384152E-12
f0_V_S_FFF java.lang.Exception: Expected 12.0 but found 5.96E-43
f0_V_S_FFF java.lang.Exception: Expected 12.0 but found 1.4E-45
f0_V_S_DDD java.lang.Exception: Expected 24.0 but found 9.020261611475E-312
f0_V_S_DDD java.lang.Exception: Expected 24.0 but found 9.02168631996E-312
f0_V_S_DDD java.lang.Exception: Expected 24.0 but found 1.8075E-319
f0_V_IS_F java.lang.Exception: Expected 12.0 but found 2.8E-45
f0_V_IS_D java.lang.Exception: Expected 24.0 but found 9.9E-324
f0_V_IS_FF java.lang.Exception: Expected 12.0 but found 2.8E-45
f0_V_IS_FF java.lang.Exception: Expected 12.0 but found 0.0
f0_V_IS_DD java.lang.Exception: Expected 24.0 but found 9.9E-324
f0_V_IS_DD java.lang.Exception: Expected 24.0 but found 2.08E-322
f0_V_IS_FFF java.lang.Exception: Expected 12.0 but found 2.8E-45
f0_V_IS_FFF java.lang.Exception: Expected 12.0 but found 0.0
f0_V_IS_FFF java.lang.Exception: Expected 12.0 but found 5.9E-44
These signatures remind me of seeing 24.0 in d0 when debugging. I didn’t think about this as much as I should have. Breaking on the branch to the address from the table is the best way to examine the state of the registers and notice 24.0 in d0. Interestingly, only the general purpose registers are shown. See r (Registers) – Windows drivers | Microsoft Docs for details on how to view and modify additional registers.
bp VarArgs!varargs+0xb0
r
rF
The pattern in the above failing signatures implies that the UnboxBindingCalculator is using the STRUCT_HFA case to place them in floating point registers. Changing the code to use the STRUCT_REGISTER case for these causes some of the cases to pass (updated MinimizedTestVarArgs as well). The last case doesn’t work though..
Starting test 6 for f0_V_S_F ... Finished test 6 for f0_V_S_F
Starting test 7 for f0_V_S_D ... Finished test 7 for f0_V_S_D
Starting test 14 for f0_V_S_FF ... Finished test 14 for f0_V_S_FF
Starting test 19 for f0_V_S_DD ... Finished test 19 for f0_V_S_DD
Starting test 46 for f0_V_S_FFF ... Finished test 46 for f0_V_S_FFF
Starting test 67 for f0_V_S_DDD ...
My initial hypothesis is that there weren’t enough registers, but if that’s the case then why does the 3 floats case work? The above bp command in the debugger shows that $LN73 of VarArgs.dll is executed and that the integer registers contain the 4 floating point values (why 5 and not 3)? Turns out the reason the test failed to be complete is because there was an AccessViolation when loading the pair x8 and x9 from [x10].
At this point, my curiosity about the correct solution for these registers leads me to create a self-contained varargs test SimpleVarArgs.c. The disassembly of call_S_DDD shows the struct being placed on the stack and a pointer to it being passed to varargs.
Volatile registers are scratch registers presumed by the caller to be destroyed across a call. Nonvolatile registers are required to retain their values across a function call and must be saved by the callee if used.
Just when I think I’m done fixing up the CallArranger so that all the Windows AArch64 floating point ABI changes are in there, I realize when going through the other changes in the PR I would open that I don’t understand exactly what WindowsAArch64VaList is used for. I based it on the MacOsAArch64VaList class but perhaps WinVaList would be more appropriate.
While reviewing all this, I take a peek at the CallArranger tests. All but one of them use CallArranger.LINUX. This means I need to create a test for Windows. After replacing LINUX with WINDOWS, I run the test on the Surface Pro X and it passes, even though it should definitely fail! Oh boy, this turns out to be a copy/paste issue – I hadn’t updated the @run testng ClassName to the new class name so a different test was running!
Structure of CallArranger Tests
testStructHFA1 creates a struct with 2 floats for a downcall. One of the arrays it passes to checkArgumentBindings starts off with the dup() binding, which “duplicates the value on the top of the operand stack (without popping it!), and pushes the duplicate onto the operand stack.“
Breaking Down WinVaList
As part of this port, I needed to implement VaList. Understanding the Windows x64 implementation (WinVaList) is helpful. The skip() method repeatedly calls MemorySegment.asSlice() to create a memory segment offset by VA_SLOT_SIZE_BYTES. WinVaList.Builder also uses VA_SLOT_SIZE_BYTES for each argument whereas MacOsAArch64VaList.Builder uses the sizeOf method to compute the slot sizes for the arguments. The definition of Utils.alignUp (shown below) is what I thought the builder was using but it is actually SharedUtils.alignUp.
// Utils.alignUp
public static long alignUp(long n, long alignment) {
    return (n + alignment - 1) & -alignment;
}

// SharedUtils.alignUp
public static long alignUp(long addr, long alignment) {
    return ((addr - 1) | (alignment - 1)) + 1;
}

// Compare these to _SLOTSIZEOF(t) in vadefs.h
#define _SLOTSIZEOF(t)  ((sizeof(t) + _VA_ALIGN - 1) & ~(_VA_ALIGN - 1))
This enables the AArch64 implementation to align up the size required for STRUCT_REGISTER and STRUCT_HFA layouts. This also matches the definition of Visual Studio’s __crt_va_arg in vadefs.h. The Builder.build() method uses MemorySegment.copyFrom().
It’s only when I start preparing to engage the OpenJDK mailing lists about a PR that I discover that there’s a separate repo for the Foreign Function & Memory API development so I need to apply my changes onto my new fork of the panama-foreign repo.
There were some conflicts to resolve after cherry-picking but nothing too bad. Looks like I didn’t have the commits starting from July when I was changing the TestAArch64CallArranger.
# To suppress the following error report, specify this argument
# after -XX: or in .hotspotrc:  SuppressErrorAt=\foreignGlobals_aarch64.cpp:181
#
# A fatal error has been detected by the Java Runtime Environment:
#
#  Internal Error (d:\dev\repos\java\forks\panama-foreign\src\hotspot\cpu\aarch64\foreignGlobals_aarch64.cpp:181), pid=18972, tid=18908
#  Error: ShouldNotReachHere()
#
# JRE version: OpenJDK Runtime Environment (20.0) (slowdebug build 20-internal-adhoc.sawesong.panama-foreign)
# Java VM: OpenJDK 64-Bit Server VM (slowdebug 20-internal-adhoc.sawesong.panama-foreign, mixed mode, tiered, compressed oops, compressed class ptrs, g1 gc, windows-aarch64)
# Core dump will be written. Default location: C:\dev\repos\java\forks\panama-foreign\JTwork\scratch\0\hs_err_pid18972.mdmp
#
# An error report file with more information is saved as:
# C:\dev\repos\java\forks\panama-foreign\JTwork\scratch\0\hs_err_pid18972.log
#
# If you would like to submit a bug report, please visit:
#   https://bugreport.java.com/bugreport/crash.jsp
#
The minimized tests I created are now out of date as well, e.g. History for test/jdk/java/foreign/TestIntrinsics.java – openjdk/panama-foreign (github.com) has 2 commits showing the changes I need to make in addition to copying the DLL from support\test\jdk\jtreg\native\lib. Suprisingly, WinDbg cannot open the executable as it did earlier. I’m launching it from C:\Program Files (x86)\Windows Kits\10\Debuggers\arm64\windbg.exe.
WinDbg could not create process
Perhaps it’s the wrong one for the current Windows version? Search for “debugger” in the store and install the WinDbg Preview app.
WinDbg Preview
Now we can set the breakpoint in foreignGlobals_aarch64.cpp:
bp jvm!move_v128
g
u jvm!move_v128
Here is the call stack when the breakpoint is hit:
Why isn’t using fmovd only failing for some test using a floating point argument?
Are my macroAssembler instructions really necessary?
Where is a test showing these instructions in use? MinimizedTestIntrinsics (run above)
Building on macOS
A newer boot JDK is required once again as explained by the error message when running bash configure. Download and install the macOS .pkg installer for JDK 19 from the adoptium site.
checking for java... /usr/bin/java
configure: Found potential Boot JDK using java(c) in PATH
configure: Potential Boot JDK found at /usr is incorrect JDK version (openjdk version "17.0.1" 2021-10-19 LTS OpenJDK Runtime Environment Microsoft-28056 (build 17.0.1+12-LTS) OpenJDK 64-Bit Server VM Microsoft-28056 (build 17.0.1+12-LTS, mixed mode)); ignoring
configure: (Your Boot JDK version must be one of: 19 20)
Testing 4-Float HFAs
I was reviewing the tests I added and realized that I wasn’t testing the variadic HFAs. Sure enough, I couldn’t get the tests for variadic HFA structs with 4 floats to pass. My code was assigning 2 64-bit general purpose registers to such a struct. Why isn’t this caught by one of the existing tests? TestVarArgs appears to simply pass the struct to the native code in the downcall and the native code passes it back in the upcall. Shouldn’t there be additional validation? testFloatStruct in VaListTest also looks like it should catch this. Is the problem that it only uses structs on the stack? Disassemble libVaList to find out:
cd build\windows-aarch64-server-slowdebug\support\test\jdk\jtreg\native\support\libVaList\
dumpbin /disasm /out:libVaList.asm libVaList.obj
dumpbin /all /out:libVaList.txt libVaList.obj
When the debugger was done loading, I ran these commands to set a breakpoint in the native code invoked by VaListTest. Unfortunately, the breakpoint was not hit. Why this happens is still a mystery.
bp VaList!sumFloatStruct
g
Adding the HFA Field Values
The function descriptor for the downcall to the native sum_struct_hfa_floats function is created by calling FunctionDescriptor.of with C_FLOAT as the first argument. This allows the result of the invokeWithArguments method of the downcall’s MethodHandle to be cast to a float. Using C_INT, for example, results in this error: ClassCastException: java.lang.Integer cannot be cast to class java.lang.Float.
Validating the HFA Field Values
Although the existing varargs tests passed, they looked like they checked round-tripping of a single value. Adding the components of the HFA seemed like a better idea because it verified that all the values were delivered correctly. This caught a bug in my implementation – when there aren’t enough registers for a HFA being passed to a variadic function, the struct was partially loaded into the available registers and then the rest of the struct was spilled onto the stack. This behavior differs from the macOS & Linux environments and wasn’t caught by any of the existing tests.
In the process of testing these changes, I deployed the locally built JDK to the Surface Pro X and got this cryptic error message:
C:\dev\java\abi\devbranch35\jdk\bin\java.exe --enable-preview SumVariadicStructHfa
WARNING: A restricted method in java.lang.foreign.Linker has been called
WARNING: java.lang.foreign.Linker::nativeLinker has been called by the unnamed module
WARNING: Use --enable-native-access=ALL-UNNAMED to avoid a warning for this module

Exception in thread "main" java.lang.UnsatisfiedLinkError: C:\dev\repos\scratchpad\compilers\tests\aarch64\abi\varargs\VarArgs.dll: Can't load ARM 64-bit .dll on a AMD 64-bit platform
        at java.base/jdk.internal.loader.NativeLibraries.load(Native Method)
        at java.base/jdk.internal.loader.NativeLibraries$NativeLibraryImpl.open(NativeLibraries.java:331)
        at java.base/jdk.internal.loader.NativeLibraries.loadLibrary(NativeLibraries.java:197)
        at java.base/jdk.internal.loader.NativeLibraries.loadLibrary(NativeLibraries.java:139)
        at java.base/jdk.internal.loader.NativeLibraries.findFromPaths(NativeLibraries.java:259)
        at java.base/jdk.internal.loader.NativeLibraries.loadLibrary(NativeLibraries.java:251)
        at java.base/java.lang.ClassLoader.loadLibrary(ClassLoader.java:2437)
        at java.base/java.lang.Runtime.loadLibrary0(Runtime.java:873)
        at java.base/java.lang.System.loadLibrary(System.java:2047)
        at SumVariadicStructHfa.<clinit>(SumVariadicStructHfa.java:61)
Turns out I deployed x64 binaries to the Surface Pro X and launched Java in a folder containing the prior ARM64 varargs test DLL. The solution was to delete that DLL and copy the DLL from the new build. The test passed successfully and it’s only then that I realized that x64 binaries run successfully on this ARM64 platform. Getting the correct ARM64 binaries in place without replacing the x64 varargs will give a similar error Exception in thread "main" java.lang.UnsatisfiedLinkError: C:\dev\repos\scratchpad\compilers\tests\aarch64\abi\varargs\VarArgs.dll: Can't load AMD 64-bit .dll on a ARM 64-bit platform.
Outstanding Questions
Why invoke and instead of invokeExact in the tests?
What happens if we return the method handle without the .asSpreader call?
Why do we need to shuffle the PrintfArgs?
Remove dead code
Show how to debug (VS/VS Code) into the native code (on Windows x64 first, then ARM64).
Generate logs showing the wrong downcall registers in use without my changes
Generate logs showing the wrong upcall registers in use without my changes
Make foreign+upcalls log the upcall stub details as is done for the downcall stubs.
Why does using r10 as the retBufAddrStorage field work on Windows? Is there not test for returning a struct?
Create test that returns a 16-byte result and verify that it is in x1:x0 (no tests failed with this change).
Create test that returns result in address stored in x8 – see Return Values: For types greater than 16 bytes, the caller shall reserve a block of memory of sufficient size and alignment to hold the result. The address of the memory block shall be passed as an additional argument to the function in x8. The callee may modify the result memory block at any point during the execution of the subroutine. The callee isn’t required to preserve the value stored in x8. How does this compare to the comments in assembler_aarch64.hpp, downcallLinker_aarch64.cpp, stubGenerator_aarch64.cpp?
Create test that uses r16-r17 and v24 and verify that they really are volatile.
Fix d24 not being a volatile register
Why doesn’t any test fail without the cursor update in MacOsAArch64VaList.Builder.read?