As I learn about systems performance, one question that often arises is who is responsible for the context switching on a system. In Linux, the number of context switches per second is displayed by vmstat. To see this information every second, for example, run vmstat 1. Here is sample output from my Ubuntu 22.04 VM showing about 50000 context switches per sec. I used the -SM option to display memory info in Megabytes (which reduces the amount of output per line). The last (optional) argument is the number of updates (lines) to be displayed.
saint@ubuntuvm:~$ vmstat -SM 1 5
procs -----------memory---------- ---swap-- -----io---- -system-- ------cpu-----
 r  b   swpd   free   buff  cache   si   so    bi    bo   in   cs us sy id wa st
 2  0      0   4603    386   5176    0    0     1     5   16    7 35  6 59  0  0
 4  0      0   4603    386   5176    0    0     0    88 20031 45649 51  8 41  0  0
 4  0      0   4603    386   5176    0    0     0     0 23768 52532 49  8 43  0  0
 4  0      0   4603    386   5176    0    0     0     0 23826 52931 49  7 43  0  0
 5  0      0   4603    386   5176    0    0     0     0 23328 51731 49  9 43  0  0
Use pidstat to get a per-process breakdown of context switches per second. Like vmstat, a report delay and a report count can be specified. Without specifying any specific flags, the default output is a breakdown of CPU usage.
For our purposes, we need to specify the -w flag to report task switching activity. After the specified number of reports have been displayed, the average number of context switches (voluntary and involuntary) are displayed.
I happened to have my factorization Java application running on this VM. Interestingly, it does not appear in this output despite the fact that the time command displays a large number of context switches for this application. To see this, set up the application as described in the next section.
Running a Sample Multithreaded Application
Clone the scratchpad repo then compile and launch the factorization application using these instructions (with any necessary changes to the JAVA_HOME path):
# Download a Java build if necessary
mkdir -p ~/java/binaries/jdk/x64
cd ~/java/binaries/jdk/x64
wget https://aka.ms/download-jdk/microsoft-jdk-17.0.7-linux-x64.tar.gz
tar xzf microsoft-jdk-17.0.7-linux-x64.tar.gz

# Set the JAVA_HOME environment variable
export JAVA_HOME=~/java/binaries/jdk/x64/jdk-17.0.7+7

# Get the Factorization source code
mkdir ~/repos
cd ~/repos
git clone https://github.com/swesonga/scratchpad
cd scratchpad/demos/java/FindPrimes

# Compile the factorization source code
$JAVA_HOME/bin/javac Factorize.java

# Factorize a number and display task statistics
/usr/bin/time -v $JAVA_HOME/bin/java Factorize 897151542039582592342572091 CUSTOM_THREAD_COUNT_VIA_THREAD_CLASS 6
Notice the context switching statistics when the command completes:
	Command being timed: "/home/saint/java/binaries/jdk/x64/jdk-20+36/bin/java Factorize 897151542039582592342572091 CUSTOM_THREAD_COUNT_VIA_THREAD_CLASS 6"
	User time (seconds): 37.59
	System time (seconds): 6.47
	Percent of CPU this job got: 363%
	Elapsed (wall clock) time (h:mm:ss or m:ss): 0:12.12
	Average shared text size (kbytes): 0
	Average unshared data size (kbytes): 0
	Average stack size (kbytes): 0
	Average total size (kbytes): 0
	Maximum resident set size (kbytes): 298576
	Average resident set size (kbytes): 0
	Major (requiring I/O) page faults: 8
	Minor (reclaiming a frame) page faults: 70247
	Voluntary context switches: 367393
	Involuntary context switches: 1337
	Swaps: 0
	File system inputs: 0
	File system outputs: 64
	Socket messages sent: 0
	Socket messages received: 0
	Signals delivered: 0
	Page size (bytes): 4096
	Exit status: 0
Per-Thread Task Switching Information
How can get some insight into the context switching in the Java process? We can also display statistics for threads associated with selected tasks using the -t option. We now get insight into Java’s contribution to context switching:
Given the large number of tasks on the system, it may be helpful to focus on Java alone. Running jps shows the pids of the Java processes running. We can pass the PID of interest to pidstat. Only context switches for that process will now be displayed, e.g.
To store encrypted git credentials on disk in Ubuntu, install pass and the git-credential-manager. We will use gpg to generate a key that pass will use for secure storage and retrieval of credentials. Use these commands to get everything set up for git:
saint@ubuntuvm:~/repos/scratchpad$ git push
Username for 'https://github.com': swesonga
Password for 'https://swesonga@github.com':
remote: Permission to swesonga/scratchpad.git denied to swesonga.
fatal: unable to access 'https://github.com/swesonga/scratchpad/': The requested URL returned error: 403
saint@ubuntuvm:~/repos/scratchpad$ sudo dpkg -i ~/Downloads/gcm-linux_amd64.2.1.2.deb
[sudo] password for saint:
Selecting previously unselected package gcm.
(Reading database ... 272980 files and directories currently installed.)
Preparing to unpack .../gcm-linux_amd64.2.1.2.deb ...
Unpacking gcm (2.1.2) ...
Setting up gcm (2.1.2) ...
saint@ubuntuvm:~/repos/scratchpad$ which git-credential-manager
/usr/local/bin/git-credential-manager
saint@ubuntuvm:~/repos/scratchpad$ git-credential-manager configure
Configuring component 'Git Credential Manager'...
Configuring component 'Azure Repos provider'...
The git push experience is now different:
saint@ubuntuvm:~/repos/scratchpad$ git push
fatal: No credential store has been selected.

Set the GCM_CREDENTIAL_STORE environment variable or the credential.credentialStore Git configuration setting to one of the following options:

  secretservice : freedesktop.org Secret Service (requires graphical interface)
  gpg           : GNU `pass` compatible credential storage (requires GPG and `pass`)
  cache         : Git's in-memory credential cache
  plaintext     : store credentials in plain-text files (UNSECURE)

See https://aka.ms/gcm/credstores for more information.

Username for 'https://github.com':
saint@ubuntuvm:~/repos/scratchpad$ git config --global credential.credentialStore
saint@ubuntuvm:~/repos/scratchpad$ git push
fatal: Password store has not been initialized at '/home/saint/.password-store'; run `pass init <gpg-id>` to initialize the store.
See https://aka.ms/gcm/credstores for more information.
Username for 'https://github.com':
Since I own the VM, I don’t mind credentials being stored on disk (but not in plain text), so I set up gpg and pass as instructed.
saint@ubuntuvm:~$ gpg --gen-key
gpg (GnuPG) 2.2.27; Copyright (C) 2021 Free Software Foundation, Inc.
This is free software: you are free to change and redistribute it.
There is NO WARRANTY, to the extent permitted by law.

Note: Use "gpg --full-generate-key" for a full featured key generation dialog.

GnuPG needs to construct a user ID to identify your key.

Real name: Saint Wesonga
Email address: saint@swesonga.org
You selected this USER-ID:
    "Saint Wesonga <saint@swesonga.org>"
...

saint@ubuntuvm:~$ sudo apt install pass
[sudo] password for saint:
Reading package lists... Done
Building dependency tree... Done
Reading state information... Done
The following additional packages will be installed:
  libqrencode4 qrencode tree xclip
Suggested packages:
  libxml-simple-perl python ruby
The following NEW packages will be installed:
  libqrencode4 pass qrencode tree xclip
0 upgraded, 5 newly installed, 0 to remove and 92 not upgraded.
Need to get 151 kB of archives.
After this operation, 442 kB of additional disk space will be used.
Do you want to continue? [Y/n]
...

saint@ubuntuvm:~$ pass init ABCDEF0123456789
mkdir: created directory '/home/saint/.password-store/'
Password store initialized for ABCDEF0123456789
Apparently I used the wrong value for the key but git push is unfazed – it pushes successfully after the browser authentication completes. I’m not sure what is happening now since browser authentication is in use but as long as I can push, I can forge ahead with other tasks.
saint@ubuntuvm:~/repos/scratchpad$ git push
info: please complete authentication in your browser...
fatal: Failed to encrypt file '/home/saint/.password-store/git/https/github.com/swesonga.gpg' with gpg. exit=2, out=, err=gpg: <WRONG HEX VALUE>: skipped: No public key
gpg: [stdin]: encryption failed: No public key

Enumerating objects: 11, done.
Counting objects: 100% (11/11), done.
Delta compression using up to 6 threads
Compressing objects: 100% (5/5), done.
Writing objects: 100% (6/6), 745 bytes | 745.00 KiB/s, done.
Total 6 (delta 3), reused 0 (delta 0), pack-reused 0
remote: Resolving deltas: 100% (3/3), completed with 3 local objects
Update: 2023-09-20. Use pass rm -r git to authenticate in the browser the next time git push is executed (e.g. if the password store secret is lost).
When Experimenting with perf on Linux, I used an Ubuntu VM. This can be a bit more cumbersome when simply trying to understand what various Linux commands can do. I decided to try using WSL to experiment with perf. Running wsl from the command line was sufficient to determine how to install the Ubuntu distribution.
C:\dev> wsl
Windows Subsystem for Linux has no installed distributions.
Distributions can be installed by visiting the Microsoft Store:
https://aka.ms/wslstore
C:\dev> wsl --install
Windows Subsystem for Linux is already installed.
The following is a list of valid distributions that can be installed.
Install using 'wsl --install -d <Distro>'.
NAME FRIENDLY NAME
Ubuntu Ubuntu
Debian Debian GNU/Linux
kali-linux Kali Linux Rolling
Ubuntu-18.04 Ubuntu 18.04 LTS
Ubuntu-20.04 Ubuntu 20.04 LTS
Ubuntu-22.04 Ubuntu 22.04 LTS
OracleLinux_7_9 Oracle Linux 7.9
OracleLinux_8_7 Oracle Linux 8.7
OracleLinux_9_1 Oracle Linux 9.1
SUSE-Linux-Enterprise-Server-15-SP4 SUSE Linux Enterprise Server 15 SP4
openSUSE-Leap-15.4 openSUSE Leap 15.4
openSUSE-Tumbleweed openSUSE Tumbleweed
C:\dev> wsl --install -d Ubuntu-22.04
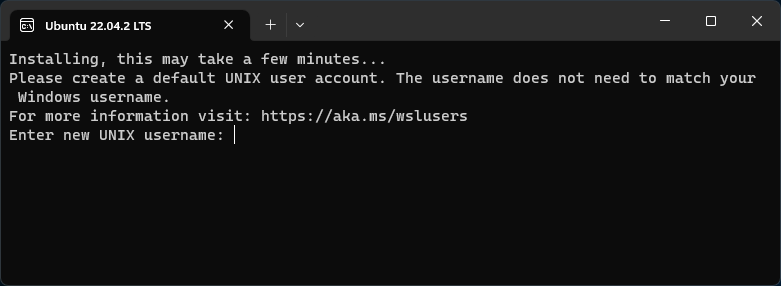
Installing: Ubuntu 22.04 LTS
Ubuntu 22.04 LTS has been installed.
Launching Ubuntu 22.04 LTS...
Creating a UNIX user account
Installing perf
Install the linux-tools-generic package then check the perf version as follows:
Once the WSL Ubuntu distro installation completed and I have created a user account, I start by checking the perf --version lets you know how it can be installed:
saint@machine:~$ perf --version
Command 'perf' not found, but can be installed with:
sudo apt install linux-intel-iotg-tools-common    # version 5.15.0-1027.32, or
sudo apt install linux-nvidia-tools-common        # version 5.15.0-1023.23
sudo apt install linux-tools-common               # version 5.15.0-71.78
sudo apt install linux-nvidia-5.19-tools-common   # version 5.19.0-1009.9
sudo apt install linux-nvidia-tegra-tools-common  # version 5.15.0-1012.12
Since I’m not looking for anything vendor specific, I try to install the linux-tools-common package.
saint@machine:~$ sudo apt install linux-tools-common
Reading package lists... Done
Building dependency tree... Done
Reading state information... Done
The following NEW packages will be installed:
  linux-tools-common
0 upgraded, 1 newly installed, 0 to remove and 0 not upgraded.
Need to get 290 kB of archives.
After this operation, 823 kB of additional disk space will be used.
Ign:1 http://archive.ubuntu.com/ubuntu jammy-updates/main amd64 linux-tools-common all 5.15.0-71.78
Err:1 http://security.ubuntu.com/ubuntu jammy-updates/main amd64 linux-tools-common all 5.15.0-71.78
  404  Not Found [IP: ... 80]
E: Failed to fetch http://security.ubuntu.com/ubuntu/pool/main/l/linux/linux-tools-common_5.15.0-71.78_all.deb  404  Not Found [IP: ... 80]
E: Unable to fetch some archives, maybe run apt-get update or try with --fix-missing?
saint@machine:~$ sudo apt install linux-tools-common
Reading package lists... Done
Building dependency tree... Done
Reading state information... Done
The following NEW packages will be installed:
  linux-tools-common
0 upgraded, 1 newly installed, 0 to remove and 41 not upgraded.
Need to get 277 kB of archives.
After this operation, 833 kB of additional disk space will be used.
Get:1 http://archive.ubuntu.com/ubuntu jammy-updates/main amd64 linux-tools-common all 5.15.0-73.80 [277 kB]
Fetched 277 kB in 0s (793 kB/s)
Selecting previously unselected package linux-tools-common.
(Reading database ... 24137 files and directories currently installed.)
Preparing to unpack .../linux-tools-common_5.15.0-73.80_all.deb ...
Unpacking linux-tools-common (5.15.0-73.80) ...
Setting up linux-tools-common (5.15.0-73.80) ...
Processing triggers for man-db (2.10.2-1) ...
Can we run a perf command now? No, perf not found for my kernel.
saint@machine:~$ perf --version
WARNING: perf not found for kernel 5.10.102.1-microsoft

  You may need to install the following packages for this specific kernel:
    linux-tools-5.10.102.1-microsoft-standard-WSL2
    linux-cloud-tools-5.10.102.1-microsoft-standard-WSL2

  You may also want to install one of the following packages to keep up to date:
    linux-tools-standard-WSL2
    linux-cloud-tools-standard-WSL2
Is that really my kernel version? Yes it is.
saint@mymachine:~$ uname -a
Linux mymachine 5.10.102.1-microsoft-standard-WSL2 #1 SMP Wed Mar 2 00:30:59 UTC 2022 x86_64 x86_64 x86_64 GNU/Linux
Unfortunately, the suggested packages cannot be found:
saint@machine:~$ sudo apt install linux-tools-standard-WSL2
Reading package lists... Done
Building dependency tree... Done
Reading state information... Done
E: Unable to locate package linux-tools-standard-WSL2
saint@machine:~$ sudo apt install linux-tools-5.10.102.1-microsoft-standard-WSL2
Reading package lists... Done
Building dependency tree... Done
Reading state information... Done
E: Unable to locate package linux-tools-5.10.102.1-microsoft-standard-WSL2
E: Couldn't find any package by glob 'linux-tools-5.10.102.1-microsoft-standard-WSL2'
nt@machine:~$ sudo apt-get install linux-tools-5.10.102.1-microsoft-standard-WSL2
Reading package lists... Done
Building dependency tree... Done
Reading state information... Done
E: Unable to locate package linux-tools-5.10.102.1-microsoft-standard-WSL2
E: Couldn't find any package by glob 'linux-tools-5.10.102.1-microsoft-standard-WSL2'
E: Couldn't find any package by regex 'linux-tools-5.10.102.1-microsoft-standard-WSL2'
The interesting thing about this is that the version numbers shown in the list of packages to be installed do not match my kernel version. However, the installation succeeds.
saint@machine:~$ sudo apt install linux-tools-generic
Reading package lists... Done
Building dependency tree... Done
Reading state information... Done
The following additional packages will be installed:
  linux-tools-5.15.0-73 linux-tools-5.15.0-73-generic
The following NEW packages will be installed:
  linux-tools-5.15.0-73 linux-tools-5.15.0-73-generic linux-tools-generic
0 upgraded, 3 newly installed, 0 to remove and 41 not upgraded.
Need to get 7931 kB of archives.
After this operation, 27.3 MB of additional disk space will be used.
Do you want to continue? [Y/n] y
Get:1 http://archive.ubuntu.com/ubuntu jammy-updates/main amd64 linux-tools-5.15.0-73 amd64 5.15.0-73.80 [7926 kB]
Get:2 http://archive.ubuntu.com/ubuntu jammy-updates/main amd64 linux-tools-5.15.0-73-generic amd64 5.15.0-73.80 [1786 B]
Get:3 http://archive.ubuntu.com/ubuntu jammy-updates/main amd64 linux-tools-generic amd64 5.15.0.73.71 [2308 B]
Fetched 7931 kB in 2s (5163 kB/s)
Selecting previously unselected package linux-tools-5.15.0-73.
(Reading database ... 24210 files and directories currently installed.)
Preparing to unpack .../linux-tools-5.15.0-73_5.15.0-73.80_amd64.deb ...
Unpacking linux-tools-5.15.0-73 (5.15.0-73.80) ...
Selecting previously unselected package linux-tools-5.15.0-73-generic.
Preparing to unpack .../linux-tools-5.15.0-73-generic_5.15.0-73.80_amd64.deb ...
Unpacking linux-tools-5.15.0-73-generic (5.15.0-73.80) ...
Selecting previously unselected package linux-tools-generic.
Preparing to unpack .../linux-tools-generic_5.15.0.73.71_amd64.deb ...
Unpacking linux-tools-generic (5.15.0.73.71) ...
Setting up linux-tools-5.15.0-73 (5.15.0-73.80) ...
Setting up linux-tools-5.15.0-73-generic (5.15.0-73.80) ...
Setting up linux-tools-generic (5.15.0.73.71) ...
perf --version still fails though. It’s not a symlink to anything else.
saint@machine:~$ ls -l `which perf`
-rwxr-xr-x 1 root root 1622 May 15 07:10 /usr/bin/perf
However, there is a user that was able to use perf by running the tool in the /usr/lib/linux-tools/… directory. Sure enough, this does the trick!
saint@machine:~$ /usr/lib/linux-tools/5.15.0-73-generic/perf --version
perf version 5.15.98
Sharing Files Between Windows and WSL Ubuntu
I was curious about whether I could generate a report from a perf.data file generated on another machine. The docs on Working across file systems show how easy it is to use a file on the Windows file system:
cd /mnt/c/dev/reports
/usr/lib/linux-tools/5.15.0-73-generic/perf report -n --stdio > report.txt
This doesn’t work though. The command fails after about 40 seconds with the error No kallsyms or vmlinux with build-id 5c3d8... was found.
mkdir -p ~/java/binaries/jdk/x64
cd ~/java/binaries/jdk/x64
wget https://aka.ms/download-jdk/microsoft-jdk-17.0.7-linux-x64.tar.gz
tar xzf microsoft-jdk-17.0.7-linux-x64.tar.gz
Test the factorization application to verify that the Java build works.
export JAVA_HOME=~/java/binaries/jdk/x64/jdk-17.0.7+7

cd ~/repos/scratchpad/demos/java/FindPrimes
$JAVA_HOME/bin/javac Factorize.java
$JAVA_HOME/bin/java Factorize 123890571352112309857

# Use 4 threads to speed things up
$JAVA_HOME/bin/java Factorize 123890571352112309857 CUSTOM_THREAD_COUNT_VIA_THREAD_CLASS 4
We will need the PrintAssembly option to disassemble the code generated by the compiler when running a Java program. This option requires diagnostic VM options to be unlocked. This is the full command line for generating the disassembly from the application’s execution. The output is redirected to a code.asm file since it can be voluminous.
In the above example, I have used a Java build in a custom path. If you are using a Java build that is already installed, then a few extra steps might be needed to determine where the JAVA_HOME path, e.g.
saint@ubuntuvm:~$ which java
/usr/bin/java
saint@ubuntuvm:~$ ls -l `which java`
saint@ubuntuvm:~$ ls -l /etc/alternatives/java
cd ~/java/binaries
mkdir spark
cd spark
curl -Lo spark-3.4.0-bin-hadoop3.tgz https://dlcdn.apache.org/spark/spark-3.4.0/spark-3.4.0-bin-hadoop3.tgz

tar xzf spark-3.4.0-bin-hadoop3.tgz
cd spark-3.4.0-bin-hadoop3
Spark needs JAVA_HOME to be set (otherwise the first message displayed will be ERROR: JAVA_HOME is not set and could not be found).
Next, I started the Spark shell by running this command as per the Quick Start docs:
./bin/spark-shell
Notice that the same Hadoop warning from Diagnosing Hadoop Native Library Load Failures showed up again! However, we have already seen that the Hadoop logging level can be customized. The key question now is how to enable DEBUG logging in spark
saint@ubuntuvm:~/java/binaries/spark/spark-3.4.0-bin-hadoop3$ ./bin/spark-shell
23/06/01 10:31:38 WARN Utils: Your hostname, ubuntuvm resolves to a loopback address: 127.0.1.1; using 172.18.28.45 instead (on interface eth0)
23/06/01 10:31:38 WARN Utils: Set SPARK_LOCAL_IP if you need to bind to another address
Setting default log level to "WARN".
To adjust logging level use sc.setLogLevel(newLevel). For SparkR, use setLogLevel(newLevel).
23/06/01 10:31:44 WARN NativeCodeLoader: Unable to load native-hadoop library for your platform... using builtin-java classes where applicable
Spark context Web UI available at http://ubuntuvm.mshome.net:4040
Spark context available as 'sc' (master = local[*], app id = local-1685637105440).
Spark session available as 'spark'.
Welcome to
      ____              __
     / __/__  ___ _____/ /__
    _\ \/ _ \/ _ `/ __/  '_/
   /___/ .__/\_,_/_/ /_/\_\   version 3.4.0
      /_/

Using Scala version 2.12.17 (OpenJDK 64-Bit Server VM, Java 17.0.6)
Type in expressions to have them evaluated.
Type :help for more information.

scala>
The classpath augmentation doc (Using Spark’s “Hadoop Free” Build) is what informs me that the way Spark uses Hadoop can be customized by entries in conf/spark-env.sh. Unfortunately, there are no log level settings in the spark-env.sh.template file in that directory. After a bit of a winding journey, I discover that the way to customize the logging level is to first create a conf/log4j2.properties file by running:
Next, change the logging level by updating this line:
logger.repl.level = warn
Launching the Spark shell now displays a much more informative error message. It is now evident that the paths being searched for native libraries do not include the path we need.
23/06/01 11:16:31 DEBUG NativeCodeLoader: Trying to load the custom-built native-hadoop library...
23/06/01 11:16:31 DEBUG NativeCodeLoader: Failed to load native-hadoop with error: java.lang.UnsatisfiedLinkError: no hadoop in java.library.path: [/usr/java/packages/lib, /usr/lib64, /lib64, /lib, /usr/lib]
23/06/01 11:16:31 DEBUG NativeCodeLoader: java.library.path=/usr/java/packages/lib:/usr/lib64:/lib64:/lib:/usr/lib
23/06/01 11:16:31 WARN NativeCodeLoader: Unable to load native-hadoop library for your platform... using builtin-java classes where applicable
The required flag is the –driver-library-path. Sounds like the extraLibraryPath options didnt’ work because the JVM has already started by the time those are being processed.
It was the SPARK-7261 pull request that led me to look for the log4j2.properties file. Changing rootLogger.level did not have any effect but scrolling through revealed the key line setting logger.repl.level.
When running this test code, I noticed this warning (first message displayed):
2023-05-31 12:31:33,686 WARN util.NativeCodeLoader: Unable to load native-hadoop library for your platform... using builtin-java classes where applicable
Checking for Loadable Native Libraries
The Apache Hadoop 3.3.5 – Native Libraries Guide explains that there is a NativeLibraryChecker that can be run using the command bin/hadoop checknative -a to show which native libraries can/cannot be loaded.
saint@ubuntuvm:~/java/binaries/hadoop/hadoop-3.3.5$ find . -name lib*.so
./lib/native/libhadoop.so
./lib/native/libhdfspp.so
./lib/native/libhdfs.so
./lib/native/libnativetask.so
saint@ubuntuvm:~/java/binaries/hadoop/hadoop-3.3.5$ uname -a
Linux ubuntuvm 5.19.0-41-generic #42~22.04.1-Ubuntu SMP PREEMPT_DYNAMIC Tue Apr 18 17:40:00 UTC 2 x86_64 x86_64 x86_64 GNU/Linux
saint@ubuntuvm:~/java/binaries/hadoop/hadoop-3.3.5$ bin/hadoop checknative -a
2023-05-31 13:36:04,467 WARN util.NativeCodeLoader: Unable to load native-hadoop library for your platform... using builtin-java classes where applicable
Native library checking:
hadoop:  false
zlib:    false
zstd  :  false
bzip2:   false
openssl: false
ISA-L:   false
PMDK:    false
2023-05-31 13:36:04,711 INFO util.ExitUtil: Exiting with status 1: ExitException
Diagnosing Native Library Load Errors
My assumption when seeing that none of these native libraries could be loaded was that I needed to install all those dependencies. I started with lib64z.
saint@ubuntuvm:~/java/binaries/hadoop/hadoop-3.3.5$ sudo apt install lib64z1
Reading package lists... Done
Building dependency tree... Done
Reading state information... Done
The following additional packages will be installed:
  gcc-12-base:i386 krb5-locales libc6:i386 libc6-amd64:i386 libcom-err2:i386 libcrypt1:i386
  libgcc-s1:i386 libgssapi-krb5-2 libgssapi-krb5-2:i386 libidn2-0:i386 libk5crypto3 libk5crypto3:i386
  libkeyutils1:i386 libkrb5-3 libkrb5-3:i386 libkrb5support0 libkrb5support0:i386 libnsl2:i386
  libnss-nis:i386 libnss-nisplus:i386 libssl3 libssl3:i386 libtirpc3:i386 libunistring2:i386
Suggested packages:
  glibc-doc:i386 locales:i386 krb5-doc krb5-user krb5-doc:i386 krb5-user:i386
The following NEW packages will be installed:
  gcc-12-base:i386 krb5-locales lib64z1:i386 libc6:i386 libc6-amd64:i386 libcom-err2:i386
  libcrypt1:i386 libgcc-s1:i386 libgssapi-krb5-2:i386 libidn2-0:i386 libk5crypto3:i386
  libkeyutils1:i386 libkrb5-3:i386 libkrb5support0:i386 libnsl2:i386 libnss-nis:i386
  libnss-nisplus:i386 libssl3:i386 libtirpc3:i386 libunistring2:i386
The following packages will be upgraded:
  libgssapi-krb5-2 libk5crypto3 libkrb5-3 libkrb5support0 libssl3
5 upgraded, 20 newly installed, 0 to remove and 85 not upgraded.
Need to get 10.3 MB/12.2 MB of archives.
After this operation, 38.1 MB of additional disk space will be used.
Do you want to continue? [Y/n]
Interestingly, rerunning checknative still showed false for all the native libraries! Next step was to inspect how the checknative argument is handled. It invokes the hadoop/NativeLibraryChecker.java class, which in turn calls the hadoop/NativeCodeLoader.java. One of the most important observations in the latter file is the additional debug logging available when the library doesn’t load!
The debug output is much now more informative! Notice the warning about the possible platform mismatch of the native library!
saint@ubuntuvm:~/java/binaries/hadoop/hadoop-3.3.5$ bin/hadoop --loglevel DEBUG checknative -a
2023-05-31 14:47:32,624 DEBUG util.NativeCodeLoader: Trying to load the custom-built native-hadoop library...
2023-05-31 14:47:32,625 DEBUG util.NativeCodeLoader: Failed to load native-hadoop with error: java.lang.UnsatisfiedLinkError: /home/saint/java/binaries/hadoop/hadoop-3.3.5/lib/native/libhadoop.so.1.0.0: /home/saint/java/binaries/hadoop/hadoop-3.3.5/lib/native/libhadoop.so.1.0.0: cannot open shared object file: No such file or directory (Possible cause: can't load AARCH64-bit .so on a AMD 64-bit platform)
2023-05-31 14:47:32,625 DEBUG util.NativeCodeLoader: java.library.path=/home/saint/java/binaries/hadoop/hadoop-3.3.5/lib/native
2023-05-31 14:47:32,625 WARN util.NativeCodeLoader: Unable to load native-hadoop library for your platform... using builtin-java classes where applicable
2023-05-31 14:47:32,836 DEBUG util.Shell: setsid exited with exit code 0
Native library checking:
hadoop:  false
zlib:    false
zstd  :  false
bzip2:   false
openssl: false
ISA-L:   false
PMDK:    false
2023-05-31 14:47:32,847 DEBUG util.ExitUtil: Exiting with status 1: ExitException
1: ExitException
	at org.apache.hadoop.util.ExitUtil.terminate(ExitUtil.java:381)
	at org.apache.hadoop.util.ExitUtil.terminate(ExitUtil.java:369)
	at org.apache.hadoop.util.NativeLibraryChecker.main(NativeLibraryChecker.java:154)
2023-05-31 14:47:32,856 INFO util.ExitUtil: Exiting with status 1: ExitException
To determine the architecture for which the shared library was compiled, I started with the objdump -f command as suggested by a StackOverflow post. However, it outputs architecture: UNKNOWN!, which isn’t very useful. The file command from the same post proves to be exactly what I need.
saint@ubuntuvm:~/java/binaries/hadoop/aarch64/hadoop-3.3.5$ objdump -f lib/native/libhadoop.so

lib/native/libhadoop.so:     file format elf64-little
architecture: UNKNOWN!, flags 0x00000150:
HAS_SYMS, DYNAMIC, D_PAGED
start address 0x0000000000005b80

saint@ubuntuvm:~/java/binaries/hadoop/aarch64/hadoop-3.3.5$ file lib/native/libhadoop.so
lib/native/libhadoop.so: symbolic link to libhadoop.so.1.0.0
saint@ubuntuvm:~/java/binaries/hadoop/aarch64/hadoop-3.3.5$ file lib/native/libhadoop.so.1.0.0
lib/native/libhadoop.so.1.0.0: ELF 64-bit LSB shared object, ARM aarch64, version 1 (SYSV), dynamically linked, BuildID[sha1]=19fbe9b0a7449eb05b687721548251af752b869f, with debug_info, not stripped
Turns out I was using an x86-64 Ubuntu VM instead of the aarch64 Ubuntu VM I had created so naturally, hadoop couldn’t load the aarch64 hadoop native library! For the VM I had been using, I needed to get the hadoop build by running:
Checking the loading status of the native libraries now indicates that the hadoop native library can be successfully loaded:
saint@ubuntuvm:~/java/binaries/hadoop/x64/hadoop-3.3.5$ bin/hadoop checknative -a
2023-05-31 14:58:40,869 INFO bzip2.Bzip2Factory: Successfully loaded & initialized native-bzip2 library system-native
2023-05-31 14:58:40,877 INFO zlib.ZlibFactory: Successfully loaded & initialized native-zlib library
2023-05-31 14:58:40,887 WARN erasurecode.ErasureCodeNative: Loading ISA-L failed: Failed to load libisal.so.2 (libisal.so.2: cannot open shared object file: No such file or directory)
2023-05-31 14:58:40,887 WARN erasurecode.ErasureCodeNative: ISA-L support is not available in your platform... using builtin-java codec where applicable
2023-05-31 14:58:41,035 INFO nativeio.NativeIO: The native code was built without PMDK support.
Native library checking:
hadoop:  true /home/saint/java/binaries/hadoop/x64/hadoop-3.3.5/lib/native/libhadoop.so.1.0.0
zlib:    true /lib/x86_64-linux-gnu/libz.so.1
zstd  :  true /lib/x86_64-linux-gnu/libzstd.so.1
bzip2:   true /lib/x86_64-linux-gnu/libbz2.so.1
openssl: false Cannot load libcrypto.so (libcrypto.so: cannot open shared object file: No such file or directory)!
ISA-L:   false Loading ISA-L failed: Failed to load libisal.so.2 (libisal.so.2: cannot open shared object file: No such file or directory)
PMDK:    false The native code was built without PMDK support.
2023-05-31 14:58:41,056 INFO util.ExitUtil: Exiting with status 1: ExitException
Switching to the aarch64 Ubuntu VM also showed the aarch64 hadoop native library being successfully loaded on that platform. In hindsight, the 386 architecture references when I installed lib64z could have been a warning sign if I wasn’t just blasting my way through running these commands.
I recently needed to Use SSH keys to connect to a Linux Azure VMs from my primary development machine, a Windows desktop. OpenSSH has been available on Windows since 2018 as per this OpenSSH for Windows overview. I downloaded my private key for the Azure VM to a file called my_key.pem. Just to be sure I knew which executable would run when I launched ssh, I used this command line.
C:\> where ssh
C:\Windows\System32\OpenSSH\ssh.exe
I then passed the -i my_key.pem option to ssh when connecting to the VM.
It was then that I discovered that ssh checks the file permissions on Windows and considered them too open by default. This is the error I got:
Bad permissions. Try removing permissions for user: BUILTIN\\Users (S-1-5-32-545) on file C:/.../my_key.pem.
@@@@@@@@@@@@@@@@@@@@@@@@@@@@@@@@@@@@@@@@@@@@@@@@@@@@@@@@@@@
@         WARNING: UNPROTECTED PRIVATE KEY FILE!          @
@@@@@@@@@@@@@@@@@@@@@@@@@@@@@@@@@@@@@@@@@@@@@@@@@@@@@@@@@@@
Permissions for 'my_key.pem' are too open.
It is required that your private key files are NOT accessible by others.
This private key will be ignored.
Load key "my_key.pem": bad permissions
someuser@0.0.0.0: Permission denied (publickey).
The Security identifiers on Windows are well documented. BUILTIN\\Users (S-1-5-32-545)
A security identifier is used to uniquely identify a security principal or security group. Security principals can represent any entity that can be authenticated by the operating system, such as a user account, a computer account, or a thread or process that runs in the security context of a user or computer account.
The icacls docs explain that /reset “Replaces ACLs with default inherited ACLs for all matching files.” That doesn’t change anything on my system. The /grant option adds my personal account to the list of accounts with permission to the file.
The /inheritance:r option removes the 4 security identifiers shown previously from the private key file’s DACL. SSH is now happy to get the authentication identity from this private key file.
In the post on Experimenting with Async Profiler, I mentioned the basic (trial division) integer factorization app I wrote. I’ve been experimenting with perf to see what the system looks like when running this application. On Ubuntu, I started with this command:
perf record -F 97 -a -g -- sleep 10
Turns out perf isn’t installed by default.
WARNING: perf not found for kernel 5.19.0-41

  You may need to install the following packages for this specific kernel:
    linux-tools-5.19.0-41-generic
    linux-cloud-tools-5.19.0-41-generic

  You may also want to install one of the following packages to keep up to date:
    linux-tools-generic
    linux-cloud-tools-generic
Interestingly, running sudo apt install linux-tools-generic only picks up 5.17:
...
The following NEW packages will be installed:
  linux-tools-5.15.0-72 linux-tools-5.15.0-72-generic linux-tools-generic
...
which perf now shows /usr/bin/perf but even perf -v fails with the above warning so I have to run
sudo apt install linux-tools-5.19.0-41-generic

...
The following NEW packages will be installed:
  linux-hwe-5.19-tools-5.19.0-41 linux-tools-5.19.0-41-generic
...
Once that completes, perf can now run but perf version doesn’t display anything meaningful. Back to the original command:
perf record -F 97 -a -g -- sleep 10
This fails with an error about restricted access. Interesting reading but I just use sudo and carry on.
Error:
Access to performance monitoring and observability operations is limited.
Consider adjusting /proc/sys/kernel/perf_event_paranoid setting to open
access to performance monitoring and observability operations for processes
without CAP_PERFMON, CAP_SYS_PTRACE or CAP_SYS_ADMIN Linux capability.
More information can be found at 'Perf events and tool security' document:
https://www.kernel.org/doc/html/latest/admin-guide/perf-security.html
perf_event_paranoid setting is 4:
  -1: Allow use of (almost) all events by all users
      Ignore mlock limit after perf_event_mlock_kb without CAP_IPC_LOCK
>= 0: Disallow raw and ftrace function tracepoint access
>= 1: Disallow CPU event access
>= 2: Disallow kernel profiling
To make the adjusted perf_event_paranoid setting permanent preserve it
in /etc/sysctl.conf (e.g. kernel.perf_event_paranoid = <setting>)
Once the command completes, a perf.data file is created in the current directory. To generate a report, run this command. See the sample perf-report.txt file on GitHub.
perf report -n --stdio > perf-report.txt
To generate a flame graph, use Brendan Gregg’s scripts:
cd ~/repos
git clone https://github.com/brendangregg/FlameGraph

cd -

perf script --header > stacks.txt

~/repos/FlameGraph/stackcollapse-perf.pl < stacks.txt | ~/repos/FlameGraph/flamegraph.pl --hash > myflamegraph.svg
I have been studying the performance of a simple Java application (for integer factorization) using async-profiler. The application’s source code is on GitHub.
async-profiler is a low overhead sampling profiler for Java that does not suffer from Safepoint bias problem.
Once the application is running, use the profiler.sh script to attach to the Java process and start profiling it. I was interested in wall clock profiling. This is specified using the -e wall argument (see Part 2: Improving Performance with Async-profiler by Andrei Pangin. – YouTube). The command line below will profile the Java application with a 5ms sampling interval for a duration (-d) of 10 seconds.
# macos:
cd ~/java/binaries/async-profiler-2.9-macos

# Linux:
cd ~/java/binaries/async-profiler-2.9-linux

./profiler.sh -e wall -t -i 5ms -d 10 -f result.html jps
The jps argument above lets the profiler.sh script determine which Java process is running by calling The jps Command (oracle.com). If there are multiple Java processes, then run jps first to determine the process id of the one to be profiled then explicitly pass that pid to profiler.sh e.g.
To find out file types on macos, run file -I rawdata. In my case, I had flamegraph data that was shared as application/gzip (causing unzip to fail with End-of-central-directory signature not found. I needed to use gzip -d rawdata.
git clone https://github.com/vortexmethods/VM2D
cd VM2D
cmake .
This fails with an error about MPI missing:
-- -------------------------2D CODE-------------------------
-- Checking for module 'mpi-c'
--   Can't find mpi-c.pc in any of C:/software/strawberry/c/lib/pkgconfig
use the PKG_CONFIG_PATH environment variable, or
specify extra search paths via 'search_paths'
-- Could NOT find MPI_C (missing: MPI_C_LIB_NAMES MPI_C_HEADER_DIR MPI_C_WORKS)
-- Checking for module 'mpi-cxx'
--   Can't find mpi-cxx.pc in any of C:/software/strawberry/c/lib/pkgconfig
use the PKG_CONFIG_PATH environment variable, or
specify extra search paths via 'search_paths'
-- Could NOT find MPI_CXX (missing: MPI_CXX_LIB_NAMES MPI_CXX_HEADER_DIR MPI_CXX_WORKS)
CMake Error at C:/Program Files/CMake/share/cmake-3.25/Modules/FindPackageHandleStandardArgs.cmake:230 (message):
  Could NOT find MPI (missing: MPI_C_FOUND MPI_CXX_FOUND)
Call Stack (most recent call first):
  C:/Program Files/CMake/share/cmake-3.25/Modules/FindPackageHandleStandardArgs.cmake:600 (_FPHSA_FAILURE_MESSAGE)
  C:/Program Files/CMake/share/cmake-3.25/Modules/FindMPI.cmake:1837 (find_package_handle_standard_args)
  src/VMlib/CMakeLists.txt:31 (find_package)
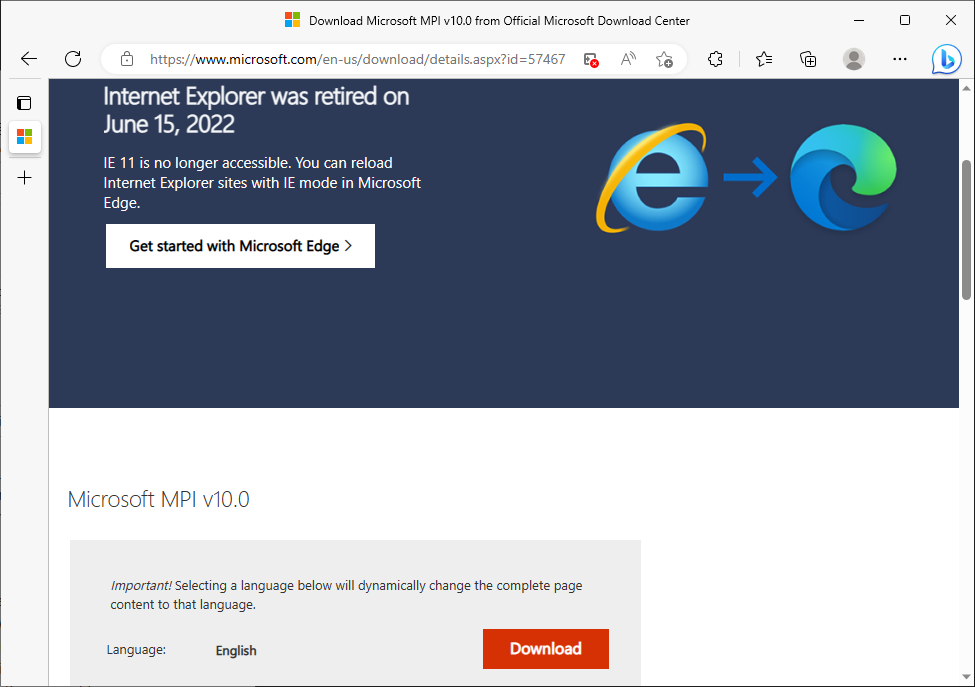
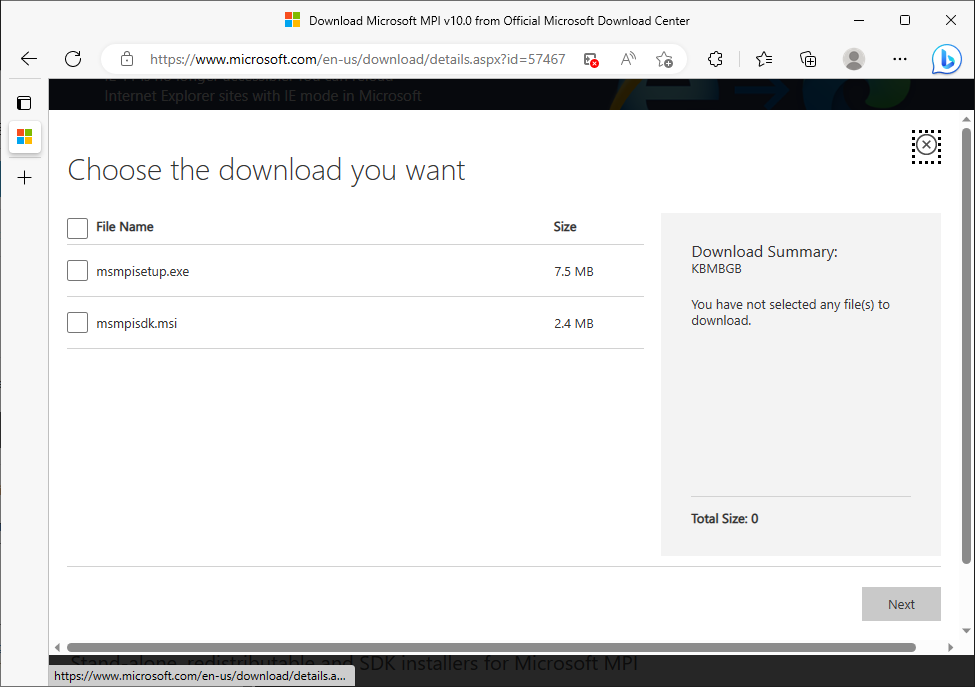
How do I know which one I want? I’ll start with the SDK MSI.
Choose the download you want
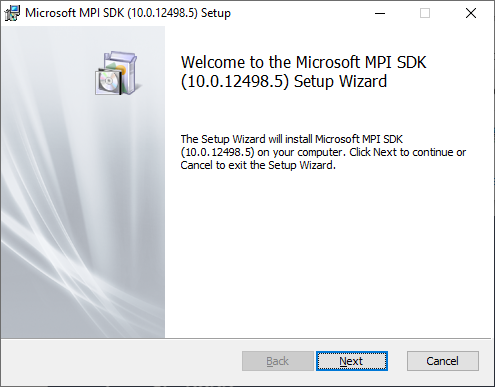
MPI SDK Setup
asdf
The publisher certificate expired in December 2021. Shouldn’t there be a warning about that? I guess the publisher is well known and not revoked? Oh well, plough ahead and install it. Reopen the developer command prompt and run cmake . again. This time, there are no errors (and I ignore all the warnings since I have things to do). A Visual Studio solution is generated. Open VM.sln in Visual Studio 2022. Building fails with these errors:
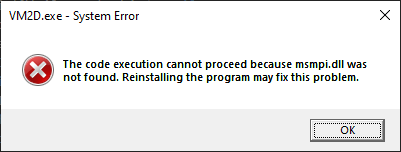
The solution is to remove the segment -gencode arch=compute_35,code=sm_35 -gencode arch=compute_37,code=sm_37 from VM2D/CMakeLists.txt · vortexmethods/VM2D (github.com). Launching the application (VM2D.exe) fails with this message: The code execution cannot proceed because msmpi.dll was not found. Reinstalling the program may fix this problem.
VM2D.exe Failing to Launch
The SDK doesn’t have that DLL, so I guess that’s what the other setup executable is for.
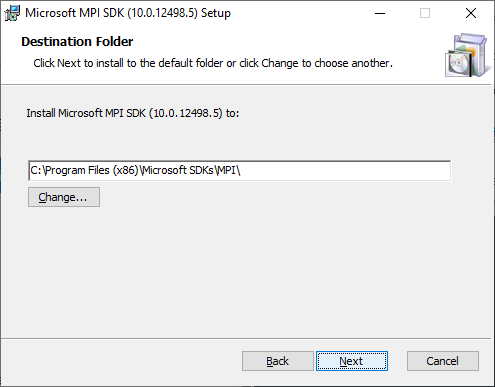
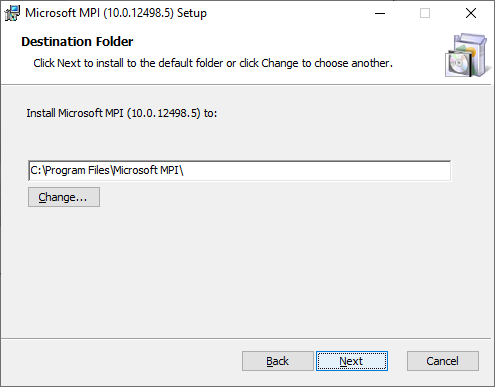
MPI 10.0.12498 Setup
MPI Setup
I don’t see any DLLs in that installation directory. However, mpi – msmpi.dll error message in Visual Studio C++ – Stack Overflow says reinstalling MPI is the solution. Before doing so, I run the application in Visual Studio once again and this time it launches successfully. This message is displayed: queue ERROR: file problems is not found. These files are in the VM2D/run folder. Other files will not be found though if using the run folder as the current directory.
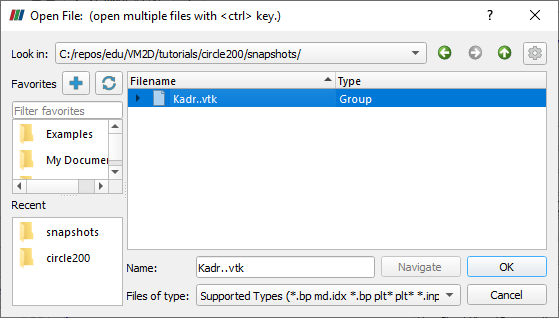
I guess I need to translate VM2D/03_starting.rst. This is the first time I have needed to translate a web page. Looks like the problems file expects to be in the tutorials directory. Copying the file in the VM2D/run folder to the VM2D/tutorials directory allows the program to find the expect files and it appears to run now. Task manager shows 100% CPU usage on my AMD Ryzen 7 5800X 8-Core Processor. The program runs for an hour and as per VM2D/05_run.rst, creates a csv file and a snapshots directory containing vtk files. To view these files, Download ParaView and install it. Launch ParaView then open the snapshots directory (it should recognize all the vtk files as a group).
Opening snapshots
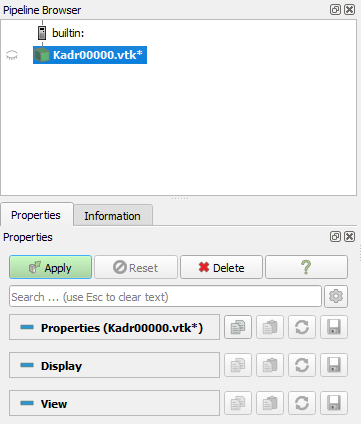
Click on the Apply button on the Properties pane (see image below).
Properties of the Snapshots
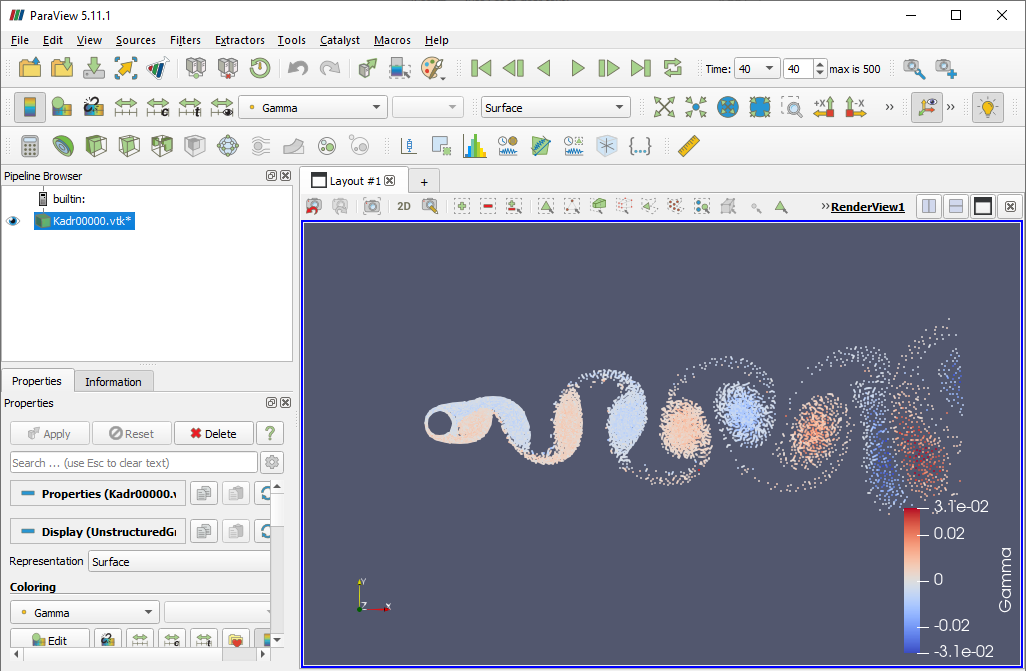
Finally, click on the Play button on the toolbar to see the animation of the snapshots. The next step will be figuring out how to use the GPU to generate these snapshots in (hopefully) much less than an hour.